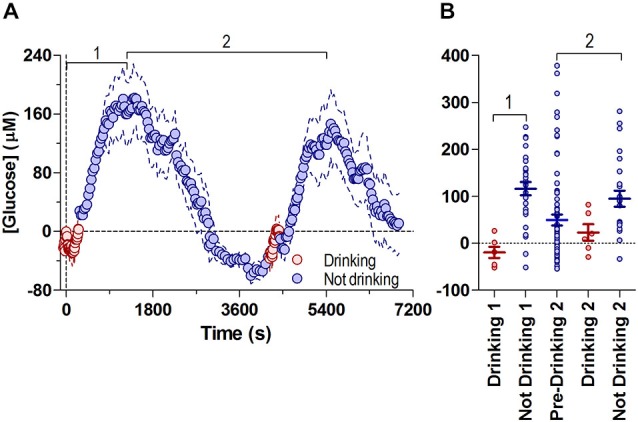
Figure 3.

Fluctuations in NAc [glucose] during both drinking bouts relative to the initial drinking bout’s baseline. Panel (A) shows overall changes in glucose concentrations during periods of drinking (8-s bins) and no drinking (30-s bins), with respect to the first bout’s initial baseline (=0), and are combined into one common time-scale. Data shown for the median time periods for each behavior (pre-drinking 1: −59 s, duration of drinking 1: 266 s, time between end of drinking 1 and start of drinking 2: 4253 s duration of drinking 2: 177 s). (B) shows the glucose concentration from all individual subjects (4 min bins) during drinking and no drinking periods in (A). Bout 1 is defined as the period from the onset of drinking 1 to the first peak in glucose concentration (1180 s), bout 2 is defined as the time between the first peak in glucose concentration 2, through the second drinking episode, to the peak in glucose concentration after the second bout (1210 s to 5494 s). Lines in (B) show mean ± SEM glucose concentration relative to the start of Drinking 1 (Drinking 1: −19.3 ± 11.74 μM, No Drinking 1: 116.5 ± 13.96 μM, Pre-Drinking 2: 49.69 ± 12.07 μM, Drinking 2: 23.07 ± 17.53 μM, No Drinking 2: 95.14 ± 17.17 μM).
