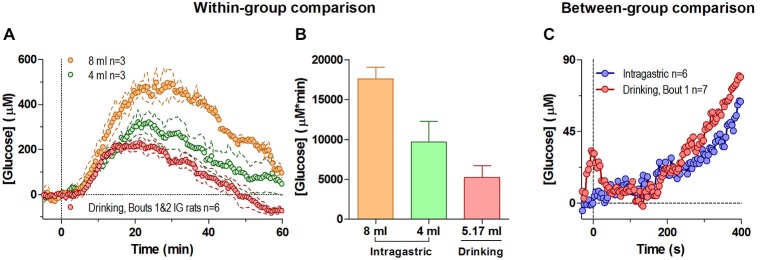
Figure 4.

Changes in NAc [glucose] induced by intra-gastric glucose injections. Panel (A) shows overall changes in NAc glucose for 60 min after intra-gastric glucose injections (4 and 8 ml) and after drinking (mean 5.17 ml) in the same rats (30-s bins). (B) compares the duration and magnitude of the response (as area under the curve) for each condition in (A), where there was an overall main effect (One-Way RM ANOVA, F(2,4) = 9.45, p < 0.05), and the difference between 8 mg and drinking approached significance p = 0.051. (C) compares the initial response between all rats when they began drinking as a result of the tube presentation, and when a subset of rats received an intragastric injection of glucose (4 and 8 mg), relative to the pre-presentation and pre-injection baseline, respectively. During this time interval the response to a 4 and 8 ml intragastric injection was not significantly different, and was combined. For clarity, error bars not shown.
