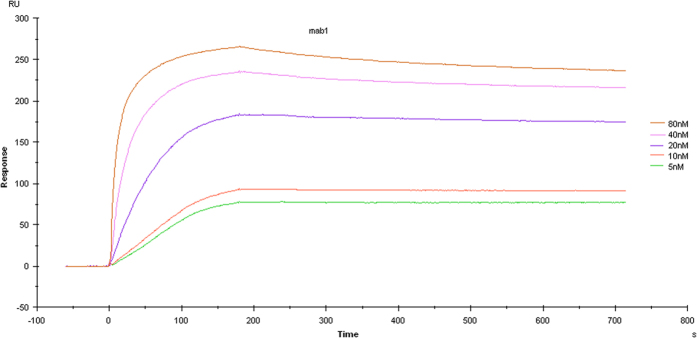
Figure 4. Affinity and kinetic assay.

hmPA6 affinity and kinetics assays showed five curves with different concentrations of anti-PA IgG ranging from 5 to 80 nmol/L; Kd = 1.438 × 10⁻¹⁰ M with PA83 at 25 μg/mL.

hmPA6 affinity and kinetics assays showed five curves with different concentrations of anti-PA IgG ranging from 5 to 80 nmol/L; Kd = 1.438 × 10⁻¹⁰ M with PA83 at 25 μg/mL.