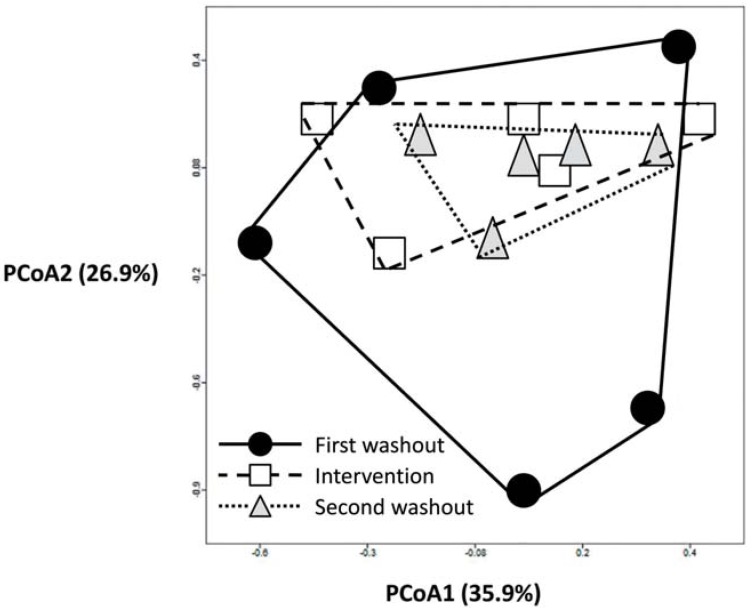
Figure 2.
The impacts of L. rhamnosus CNCM I-4036 consumption on the intestinal microbiota. The first washout, intervention and second washout refer to the different L. rhamnosus CNCM I-4036 intake phases. Principal component analysis (PCoA) score plots of the different L. rhamnosus CNCM I-4036 intake phases are shown. The data were compared with those in the Ribosomal Database Project (RDP) using a maximum e-value of 10−5, a minimum identity of 75%, and a minimum alignment length of 15 measured in bp for RNA databases. The data were normalized to values between 0 and 1, and Euclidean distance was measured in the construction of PCoA plots. Each figure represents the composition of the intestinal microbiota of one healthy volunteer.

