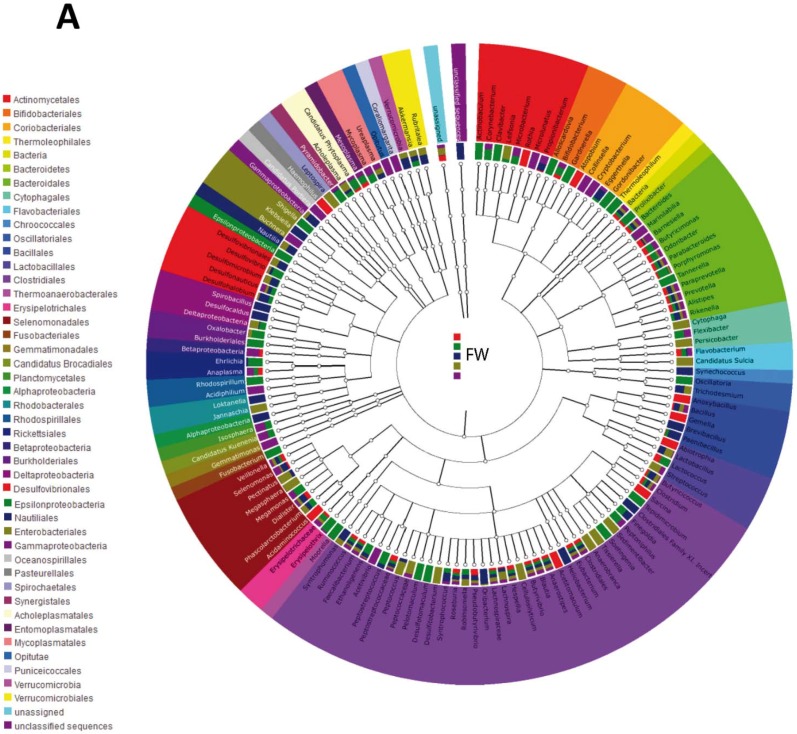
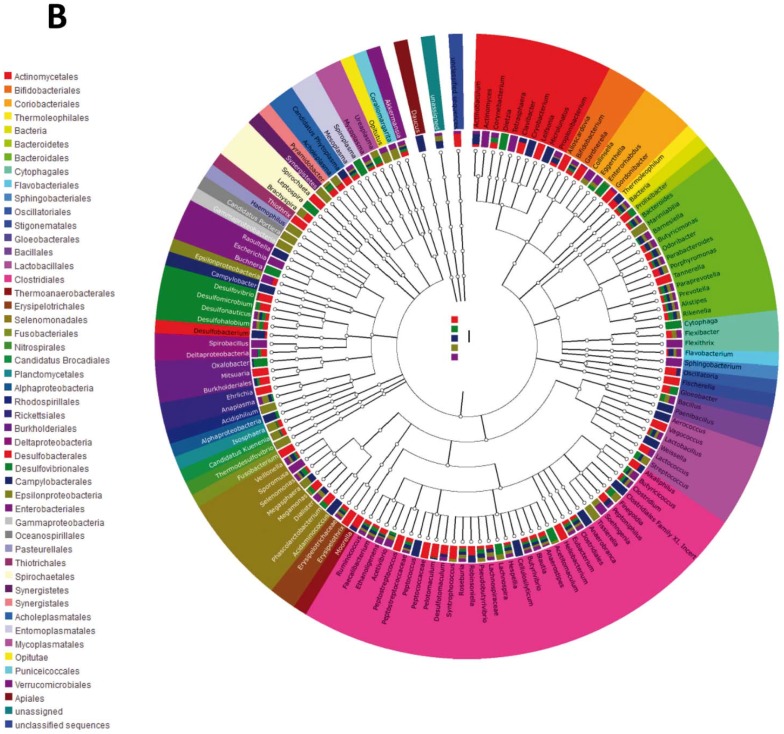
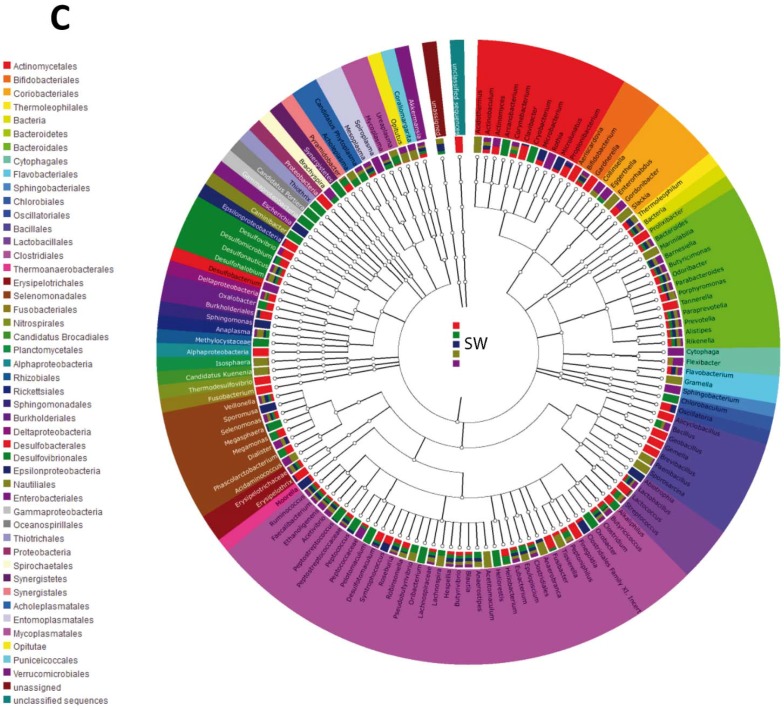
Figure 3.
Tree diagram of the different L. rhamnosus CNCM I-4036 intake phases. (A) First washout. (B) Intervention. (C) Second washout. Each tree diagram represents the composition of the intestinal microbiota of five healthy volunteers who received L. rhamnosus CNCM I-4036. Colors represent orders. FW, First washout; I, intervention; and SW, second washout.


