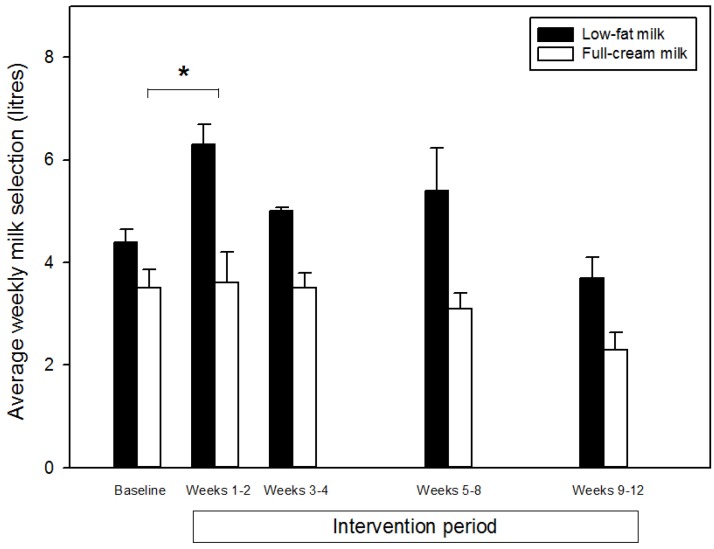
Figure 1.
Selection of low-fat and full-cream milk prior to and during a 12 week nudging intervention. Data analysis was based on weekly selection but has been presented as the mean of 12 weeks of baseline data and means of two- and four-weekly periods during the intervention period for simplicity of graphical representation. Data are mean ± standard error. *Significantly different from baseline (p = 0.03) and significantly greater increase in low-fat milk selection compared with full-cream milk selection (p = 0.01; first two weeks of the intervention period only).

