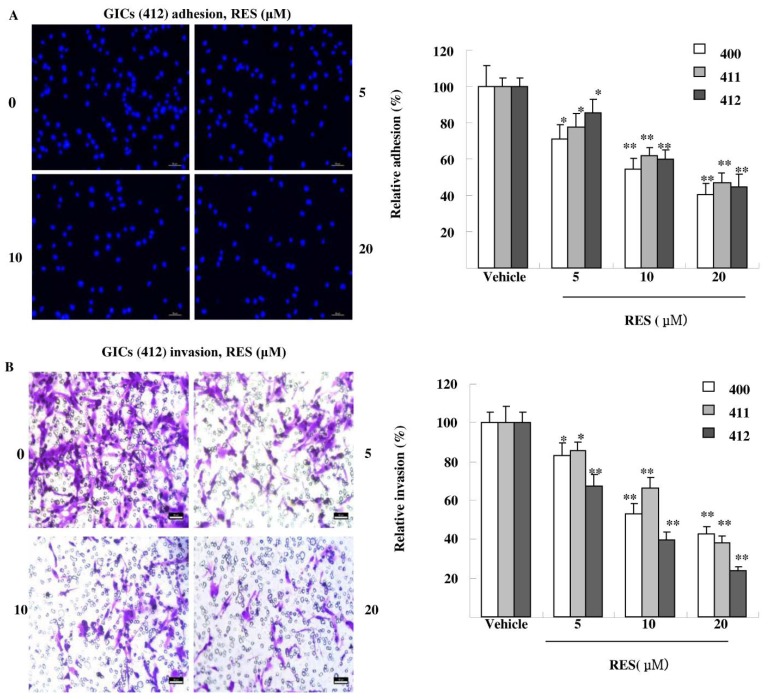
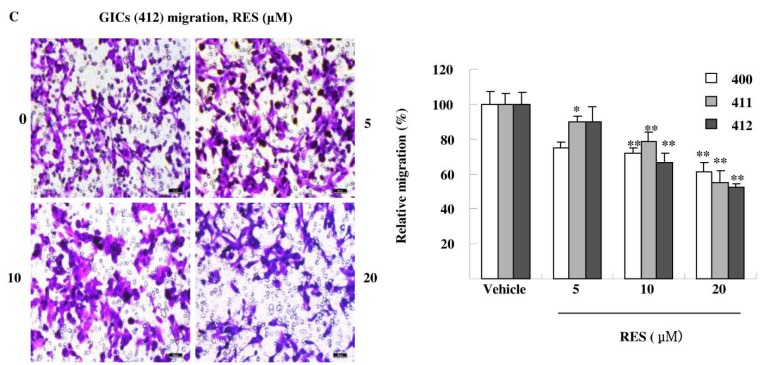
Figure 3.
RES reduces the adhesion, invasion and migration of GICs. (A) GICs (400, 411, 412) were seeded in a 96-well plate coated with matrigel and treated with DMSO (vehicle) and 5 μM, 10 μM, and 20 μM RES for 48 h, respectively. Attached cells were photographed (200×) after DAPI staining, and the number of attached cells was calculated as a percentage of adhesion. Data are shown as the means ± SD of three independent experiments by Student’s t-test. * p < 0.05, ** p < 0.01, vs. Vehicle; (B) GICs (400, 411, 412) were seeded in transwells pre-coated with matrigel and treated with DMSO (vehicle) and 5 μM, 10 μM, and 20 μM RES for 48 h, respectively. Then, randomly chosen fields were photographed (200×), and the number of cells migrated to the lower surface was calculated as a percentage of invasion. Data are shown as the mean ± SD of three independent experiments by Student’s t-test. * p < 0.05, ** p < 0.01, vs. Vehicle; (C) GICs (400, 411, 412) were seeded in transwells without matrigel and were treated with DMSO (vehicle) and 5 μM, 10 μM, and 20 μM RES for 48 h, respectively. Then, randomly chosen fields were photographed (200×), and the number of cells that migrated to the lower surface was calculated as a percentage of migration. Data are shown as the means ± SD of three independent experiments by Student’s t-test. * p < 0.05, ** p < 0.01, vs. Vehicle.


