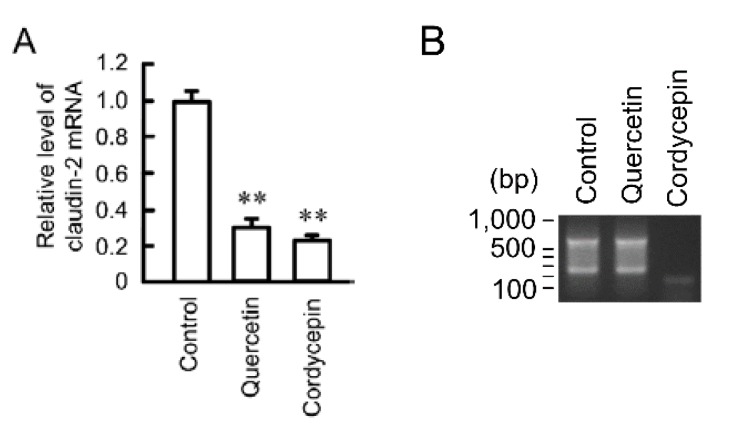
Figure 6.
Effect of quercetin on polyadenylation. (A) A549 cells were incubated in the absence (control) and presence of 50 μM quercetin or 10 μM cordycepin for 6 h. The expression level of mRNA was quantified by real-time PCR using primers for claudin-2 and β-actin, and was represented relative to values at control; (B) After reverse transcription using Olig-dT-3 sites adaptor primer, 3′-RACE PCR was carried out. The PCR products were visualized with ethidium bromide. n = 3–4. ** p < 0.01 is significantly different from control.

