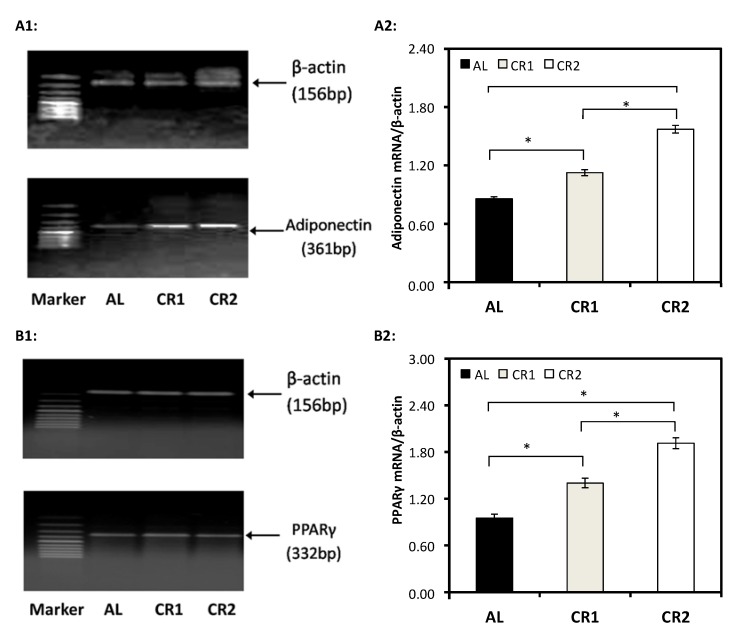
Figure 4.
The effect of calorie restriction on the expressions of adiponectin and PPARγ in adipose tissues. (A1, B1) demonstrate the expression levels of mRNA of β-actin, adiponectin and PPARγ, respectively, quantified by RT-PCR. The expression levels (absorbance) of mRNA of adiponectin and PPARγ were then normalized against those of β-actin (served as loading control) (A2, B2). One-way ANOVA followed by LSD-test was used to detect significant differences of the means, * p < 0.05.

