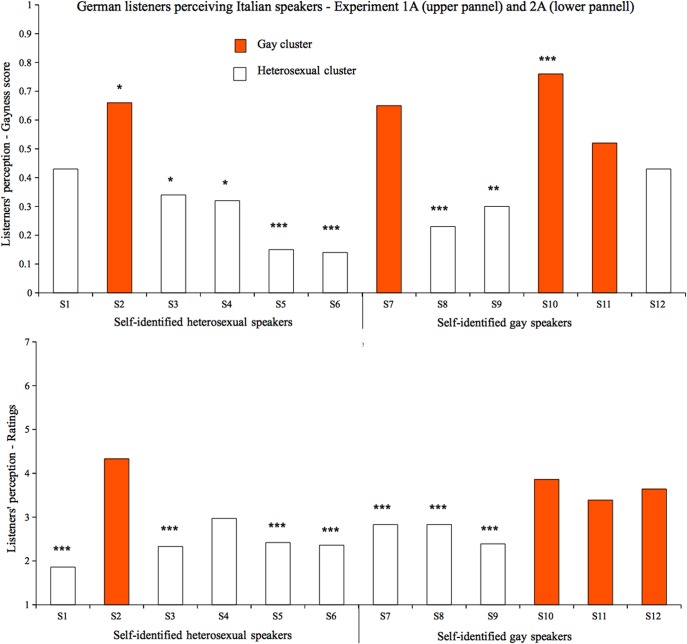
Fig 4. German listeners & German speakers.
Listeners’ perception in terms of gaynessscore (4A) and ratings (4B). Different colors indicate the two clusters based on listeners’ perception. Stars (and points) indicate speakers that were significantly perceived either as heterosexual or gay (. < .1; * <.05; ** <.01; *** <.001). Higher values of the y-axis indicate perceived gayity, lower values perceived heterosexuality; .5 represents chance level.

