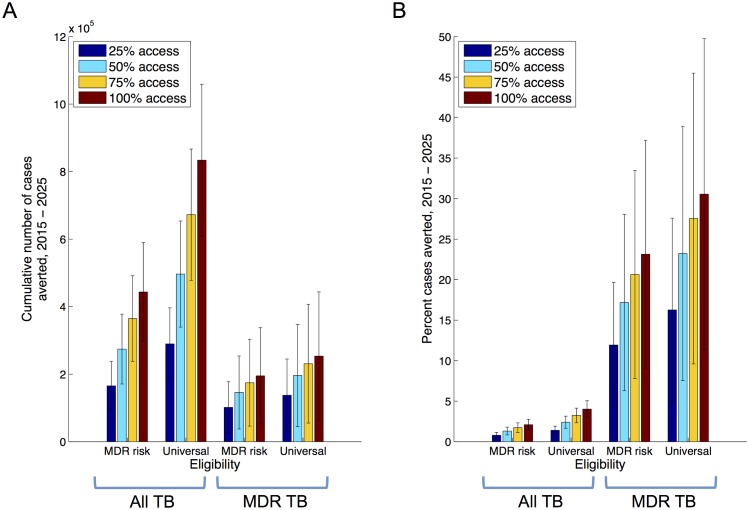
Fig 4. Impact of Xpert deployment when coupled with improved treatment success.
Simulations assume a linear scale-up of Xpert deployment (as in Fig 3), along with a linear increase in second-line treatment success in the public sector, over the same three-year period. As in Fig 3, panel A shows the cumulative numbers of cases averted from 2015 to 2025, while panel B expresses this impact as a proportion of the cases that may have occurred under the baseline scenario.

