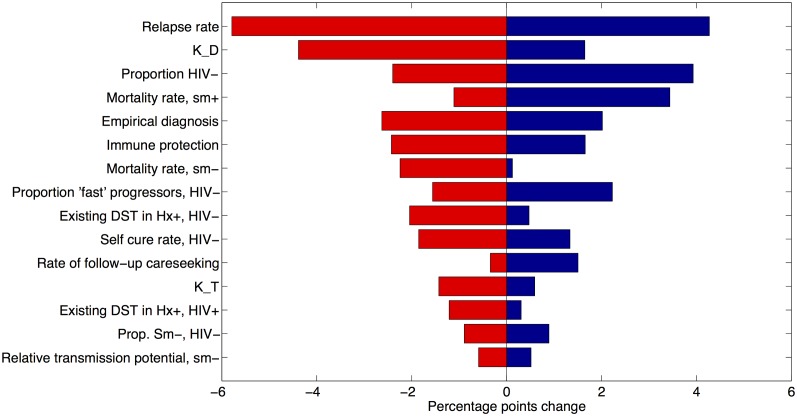
Fig 5. One-way model sensitivity to parameters held fixed in the analysis, conducted with respect to the percent cases averted of MDR-TB at 100% coverage, universal eligibility (rightmost red bar, Fig 3).
Shown here are absolute percentage changes, displaying those fifteen parameter ranges to which the model findings are most sensitive. Here, K_D represents the quality of diagnosis in the private sector relative to that in the public sector, defined as the relative probability of diagnosis per visit to a private-sector provider. Similarly, K_T represents the quality of treatment relative to the public sector, measured using the relative probability of cure. See Table 1 for assumed values and ranges for these parameters.

