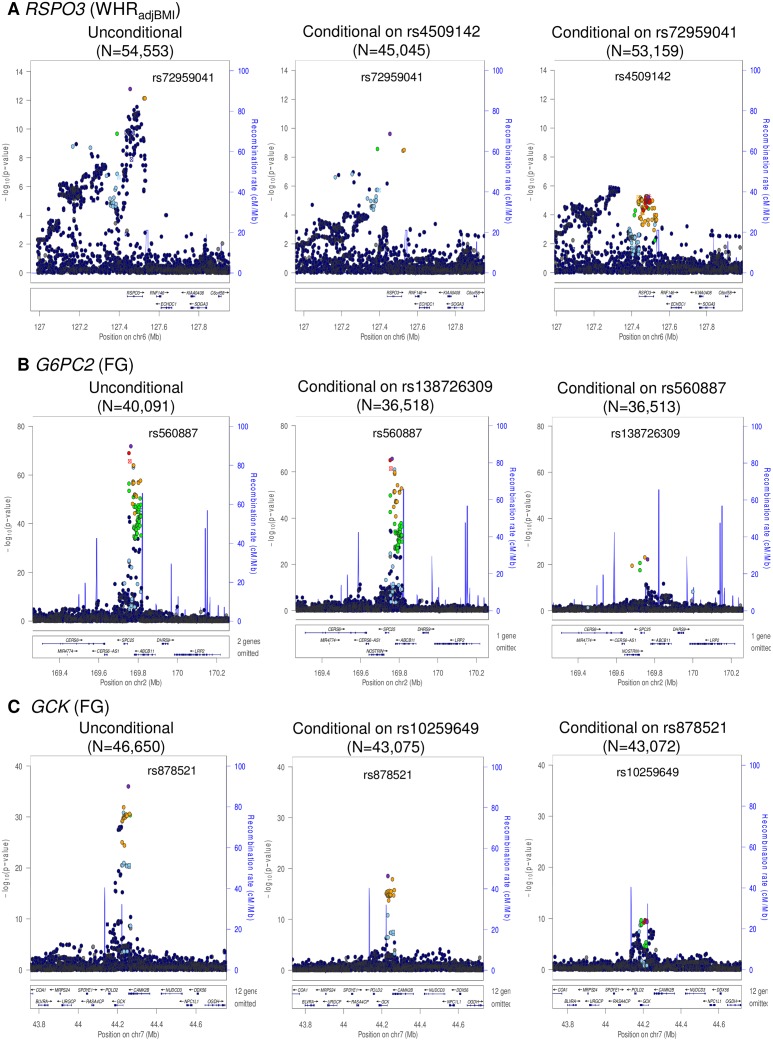
Fig 1. Regional plots of multiple distinct signals at WHRadjBMI locus RSPO3 (A), FG loci G6PC2 (B) and GCK (C).
Regional plots for each locus are displayed from: the unconditional meta-analysis (left); the exact conditional meta-analysis for the primary signal after adjustment for the index variant for the secondary signal (middle); and the exact conditional meta-analysis for the secondary signal after adjustment for the index variant for the primary signal (right). The sample sizes vary due to the availability of the well imputed index SNPs of the primary and secondary signals. Directly genotyped or imputed SNPs are plotted with their association P values (on a -log10 scale) as a function of genomic position (NCBI Build 37). Estimated recombination rates are plotted to reflect the local LD structure around the associated SNPs and their correlated proxies (according to a blue to red scale from r 2 = 0 to 1, based on pairwise EUR r 2 values from the 1000 Genomes June 2011 release). SNP annotations are as follows: circles, no annotation; downward triangles, nonsynonymous; squares, coding or 3′ UTR; asterisks, TFBScons (in a conserved region predicted to be a transcription factor binding site); squares with an X, MCS44 placental (in a region highly conserved in placental mammals).

