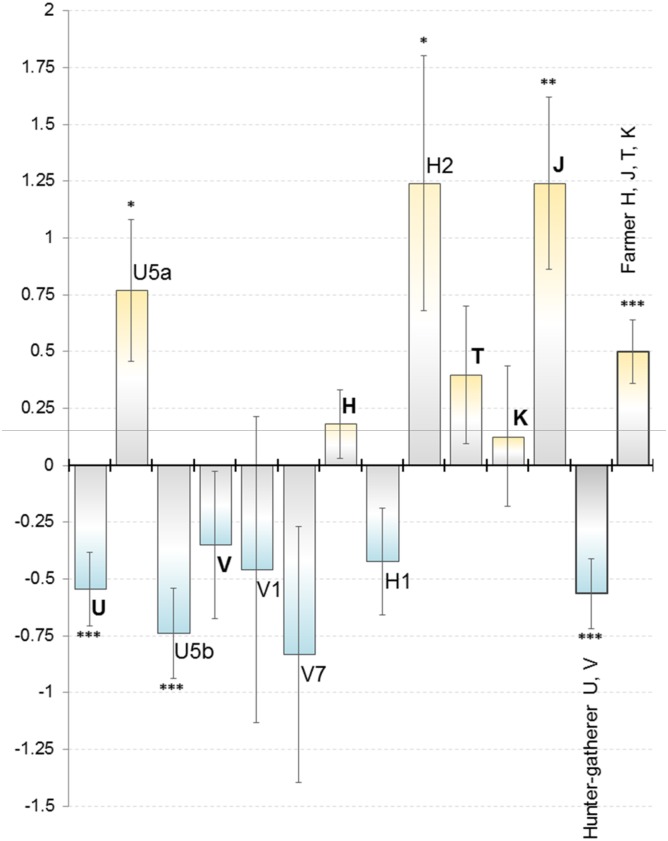
Fig 2. Logistic regression estimates representing the difference in haplogroup frequencies between the SW & NE subpopulations.
Above X-axis: SW dominance, below: NE dominance. The results are shown for division (cf. Fig 2) that maximized the difference. Error bars denote standard deviation, statistical significance is marked with stars. No statistically significant values were obtained in randomized, non-continuous divisions.

