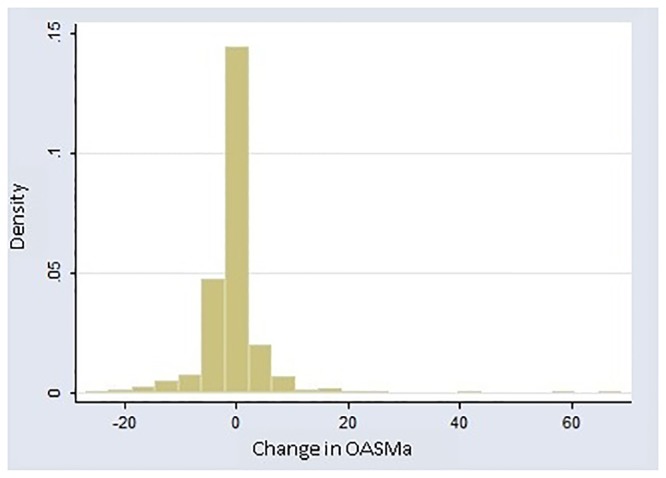
Fig 1. OASMa Change Values in Men.

OASMa = Overt-Aggression-Scale-Modified–Aggression Subscale. Note that there are 3 values for which the absolute value of change is ≥40 that are clearly separated from the main distribution. These are the designated outliers.
