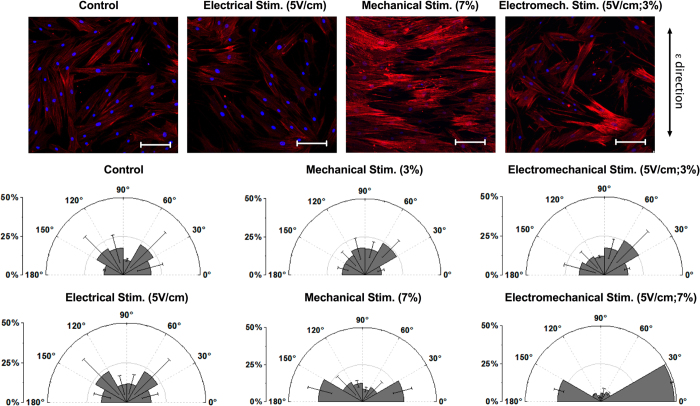
Figure 4. Qualitative and quantitative cell orientation analysis under mechanical stimulation (3% and 7% strain), electrical stimulation (5 V/cm), electromechanical stimulation (3% strain and 5 V/cm or 7% strain and 5 V/cm), and control condition (no stimulation).
(A) Nuclear and actin cytoskeleton staining. The strain direction is indicated by the arrow on the right. Scale bar is 100μm. (B) Percentage of cytoskeletal structures oriented in a given direction from 0° (horizontal, perpendicular to strain direction) to ± 90° (vertical, parallel to strain direction). Data are expressed as means ± SD.

