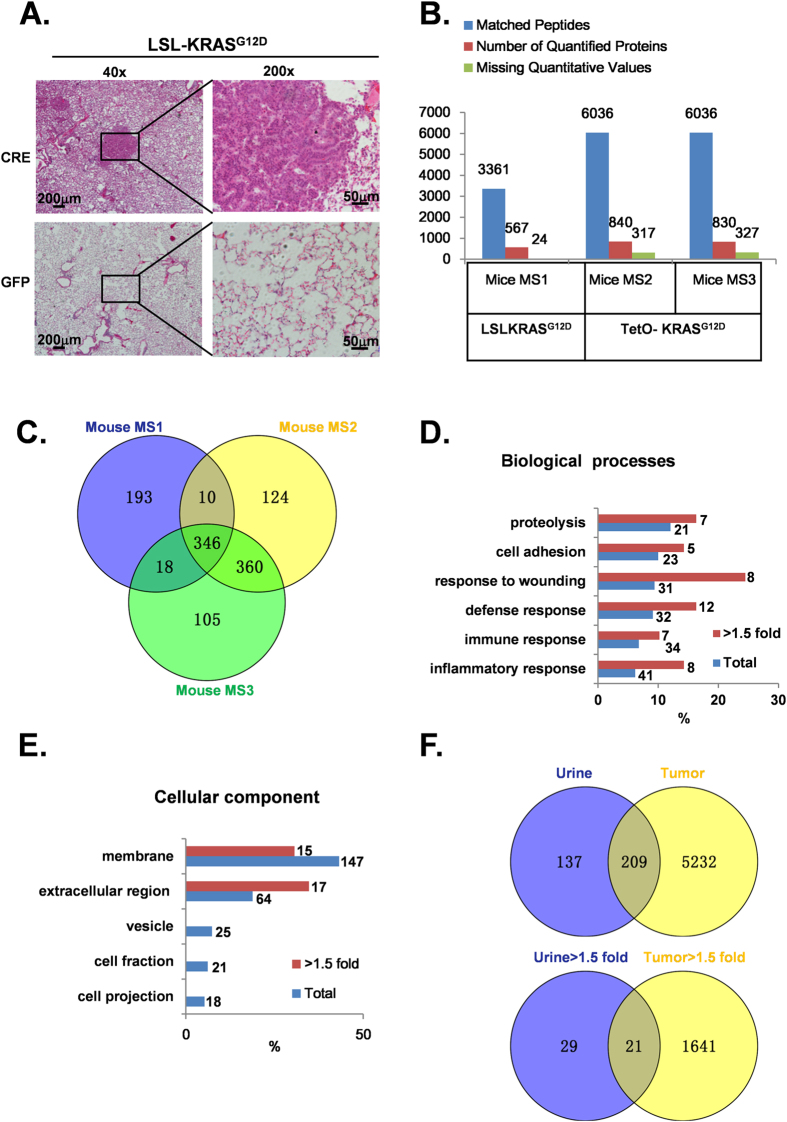
Figure 2. Proteomic comparison of urine samples derived from LSL-KRASG12D and TetO- KRASG12D mice.
A. H&E staining was performed on Ad-CRE (upper panel) and Ad-GFP (lower panel) virus-treated LSL-KRASG12D mouse lung tissues 3.5 months post-induction (scale bars represent 200 μm and 50 μm in X40 and X200 magnification, respectively). B. Overview of the proteins identified and quantified on two mouse models. The numbers of matched peptides, quantified proteins and proteins missed quantification value are shown above the bar graph. C. Comparison of 3 mouse proteomic data reveals 346 overlapped proteins. D,E. Classification of the common proteins and up-regulated (>1.5-fold change) proteins in mice urine by biological process and sub-cellular distribution. The X-axis indicates the percentage of proteins associated with each term; the numbers of proteins associated with each term are presented on the right. F. 209 protein was found to be common both in lung tumor tissue and mice urine. Of the 209 common proteins, 21 proteins were up-regulated.

