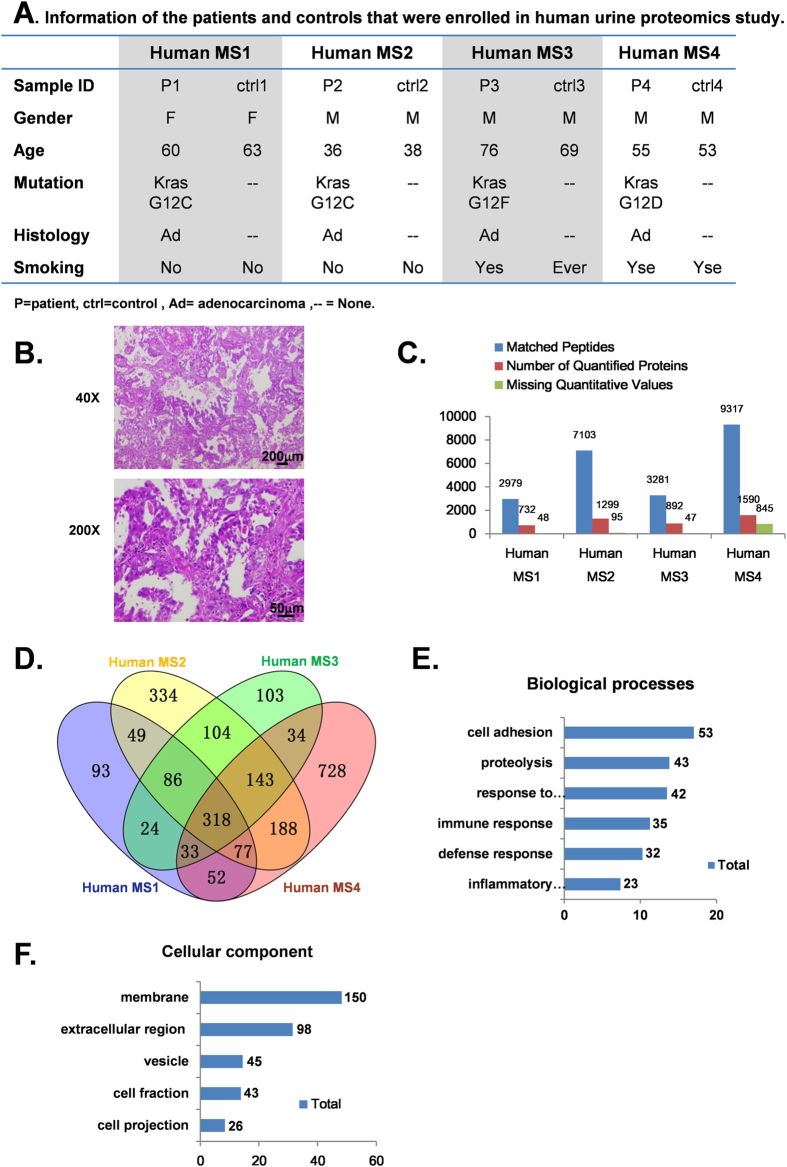
Figure 3. Proteomic alterations in urine samples of lung cancer patients compared with age- and gender-matched healthy controls.
A. Demographic information for the patients and healthy controls that were enrolled in our human urine proteomics study. B. Overview of iTRAQ LC/MS identification and quantification efficiency of the clinical urine samples. C. Histology shows lung adenocarcinoma from 1 patient. Scale bars represent 200 μm and 50 μm at X40 and X200 magnification, respectively. D. A total of 732, 1299, 845, and 1590 proteins were successfully quantified in 4 independent proteomic analyses. The intersection shows 318 proteins that were identified in four groups simultaneously. Of the 318 proteins, 24 were up-regulated (>1.5-fold change). E,F. Classification of the common proteins in human urine by biological processes and sub-cellular distribution (p < 0.05). The X-axis indicates the percentage of protein associated with term; the numbers of proteins included in each group are presented on the right.

