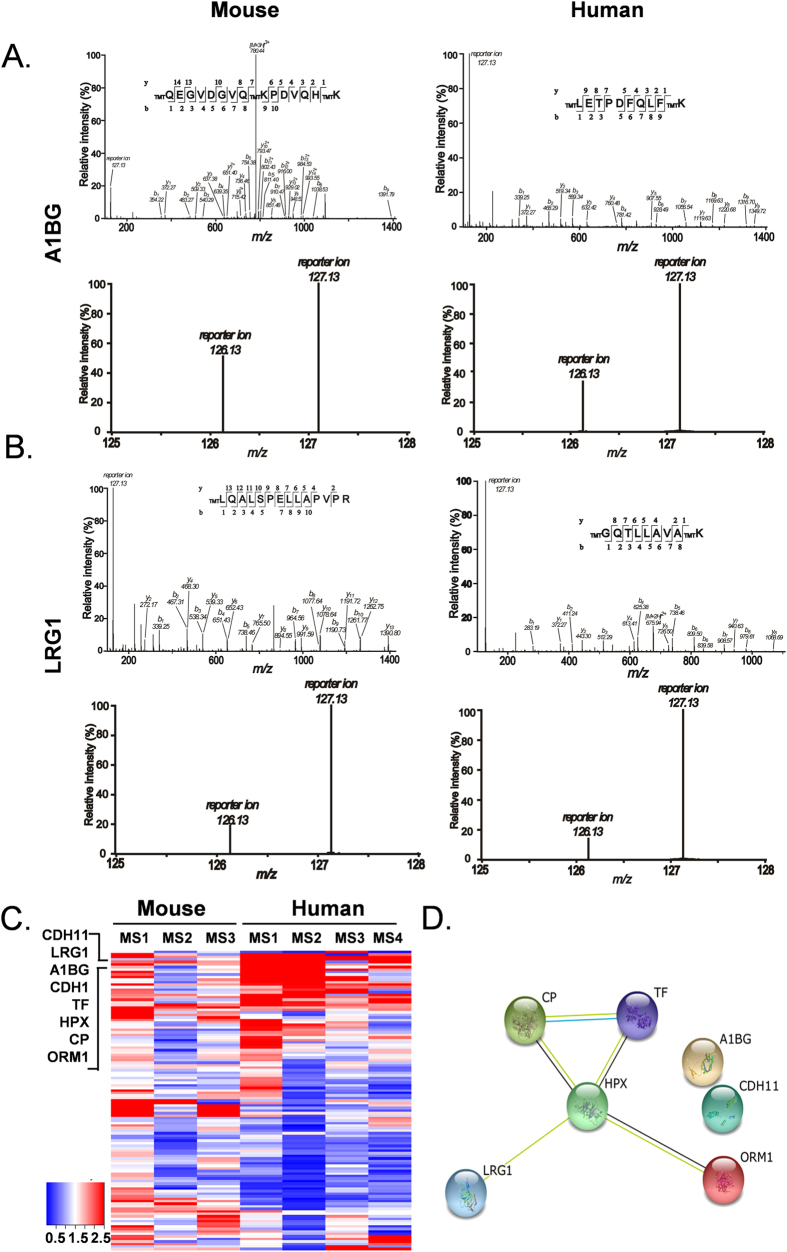
Figure 4. Bioinformatics analysis of the 7 commonly up-regulated proteins.
A,B. MS/MS spectra representing A1BG and LRG1 identified in mouse (left panel) and human (right panel) urine. C. Heatmap of 119 common proteins between 3 groups of mice and 4 groups of human urine proteomic analysis. D. STRING analysis shows the interaction network of the 7 up-regulated proteins.

