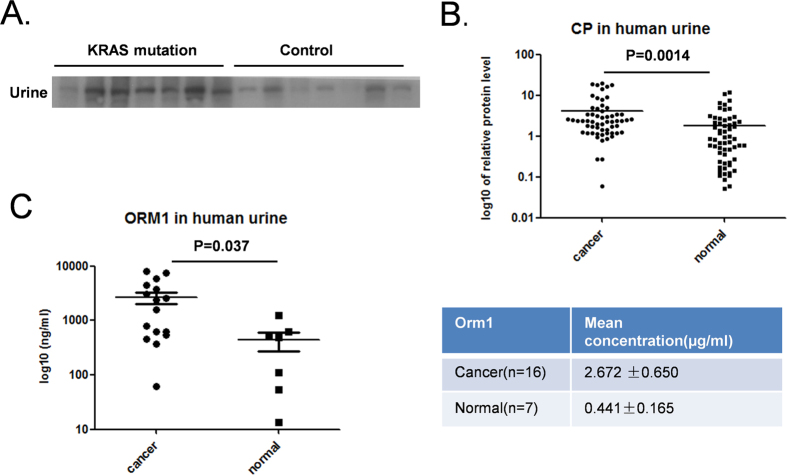
Figure 5. Validation of candidate proteins.
A. Western blotting analysis of CP in the urine of 7 KRAS mutation lung cancer patients and 7 healthy controls. B. Quantification of CP protein levels in urine from 60 cancer patients and 60 healthy controls by western blotting. Band intensities were quantified by ImageJ, p = 0.0014. C. Orm1 protein levels were tested in 16 cancer samples and 7 normal controls using a commercial ELISA kit (p = 0.037). The left panel shows the ELISA results of individual samples; the right panel shows the mean concentration ± SD of the two cohorts.

