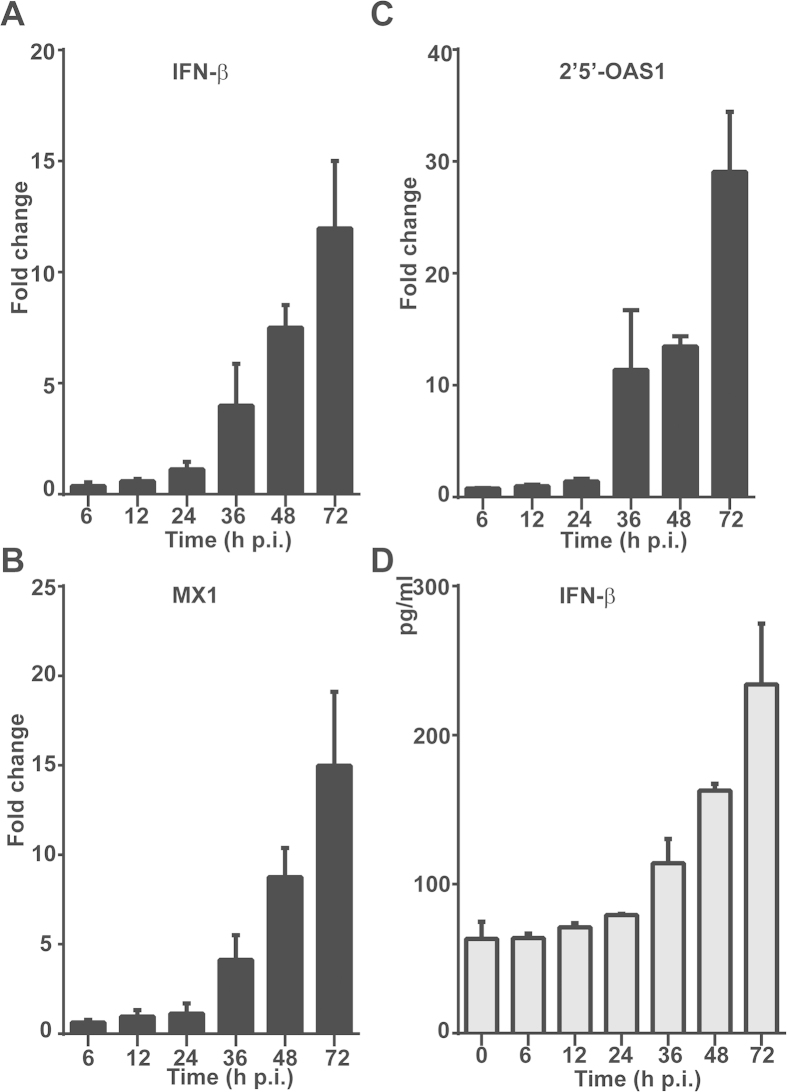
Figure 6. Antiviral responses induced in SFTSV-infected liver epithelial cells.
Total RNA was prepared from uninfected and infected cells at various time points p.i., and real-time RT-PCR was performed to measure mRNA transcript levels of IFN-β (A), MX1 (B), and 2’5’-OAS1 (C) at 6, 12 , 24 , 36 ,48 and 72 hrs p.i. respectively. (D) Cytokine concentrations in culture media were measure by ELISA for the expression levels of IFN-β.

