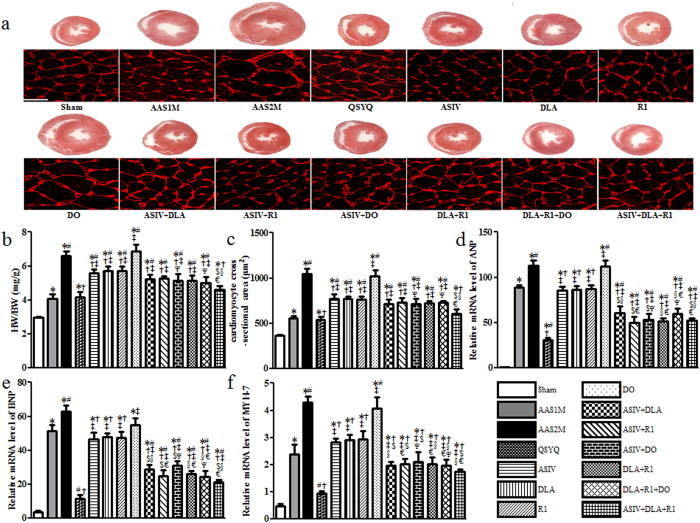
Figure 2. The effect of different drug treatments on CH.
a Representative rat heart cross sections in different conditions with sections stained by WGA showing below demarcating cell boundaries (Bar = 25 μm). The heart sections were cut across the middle of heart vertical axis. b Quantitative evaluation of HW/BW. c Quantitative measurement of cardiomyocyte cross-sectional area. d–f Semi-quantitative analysis of ANP (d), BNP (e) and MYH-7 (f) mRNA level. The data are presented as mean ± S.E. *p < 0.05 vs. Sham, #p < 0.05 vs. AAS1M, †p < 0.05 vs. AAS2M, ‡p < 0.05 vs. QSYQ, $p < 0.05 vs. ASIV, §p < 0.05 vs. DLA, €p < 0.05 vs. R1, Ψp < 0.05 vs. DO. n = 6.

