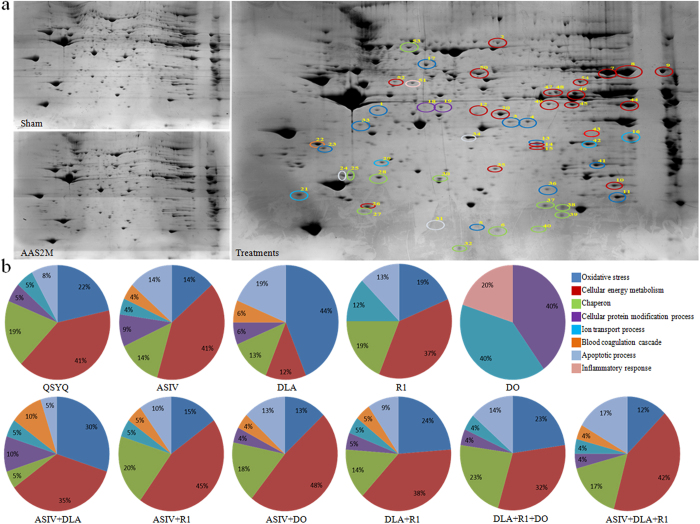
Figure 4. Proteomic analysis of the differentially expressed proteins in each group.
a Representative images of the PhastGel Blue R stained two-dimensional gels of Sham, AAS2M and treatments group. Colorful circles in treatments indicate the differentially expressed spots from all drug treatments groups. b The proportion of various functional category in differentially expressed proteins in each group. n = 3.

