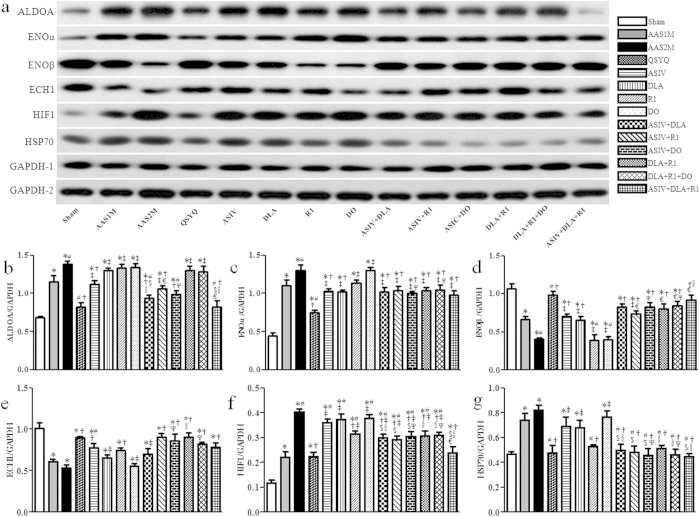
Figure 5. Western blot of proteins related to energy metabolism pathway in different groups.
a The representative western blotting bands of each protein in different groups. b–g The semi-quantitative analysis of ALDOA (b), ENOα (c) ENOβ (d), ECH1 (e), HIF1 (f) and HSP70 (g) in various groups. The bands of ALDOA, ENOβ, HIF1 and GAPDH-2 were cropped from one gel, while the bands of ECH1, ENOα, HSP70 and GAPDH-1 were cropped from another gel, as shown in Supplementary Fig. S5a with indication of molecular size. The quantification was based on the data of 3 independent experiments and normalized to GAPDH. The data are presented as mean ± S.E. *p < 0.05 vs. Sham, #p < 0.05 vs. AAS1M, †p < 0.05 vs. AAS2M, ‡p < 0.05 vs. QSYQ, $p < 0.05 vs. ASIV, §p < 0.05 vs. DLA, €p < 0.05 vs. R1, Ψp < 0.05 vs. DO. n = 4.

