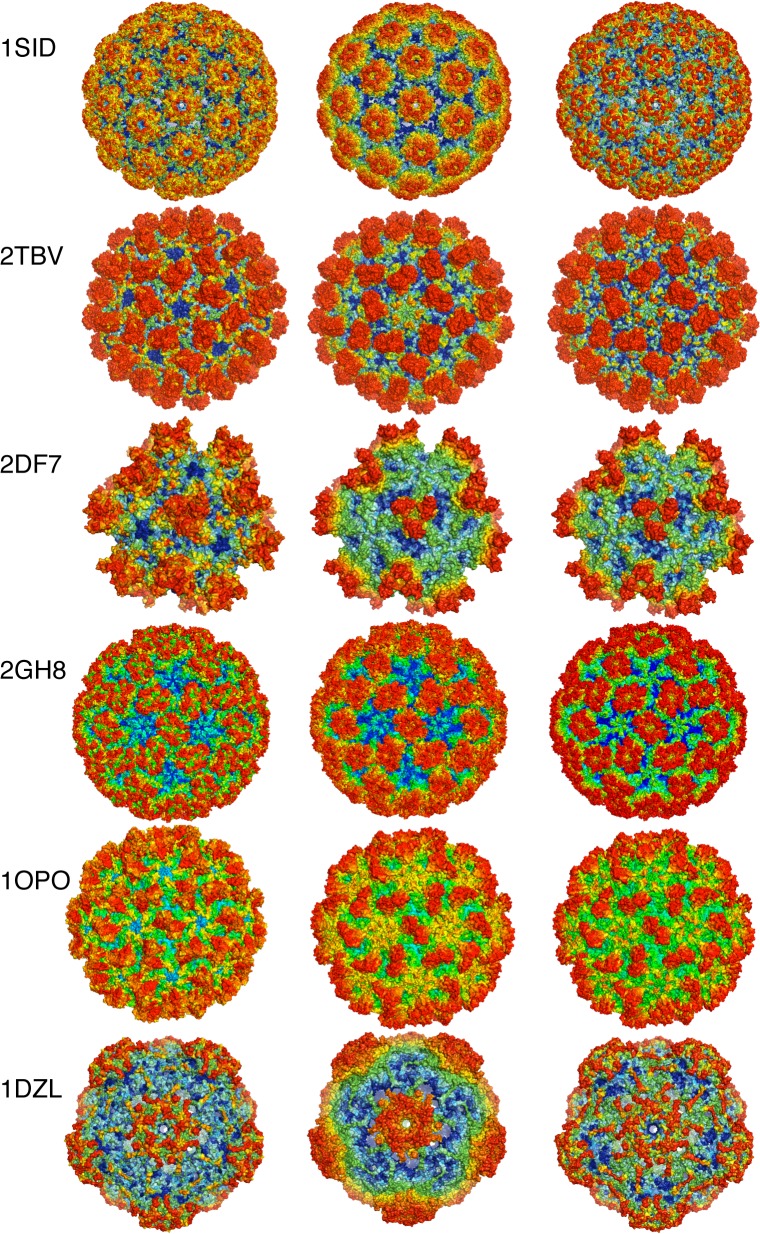
Fig 1. The capsid crystal structures of 6 viruses.
Each structure is represent by three surface representations: the conservation-colored structure is shown on the left, the c-distance-colored structure in the middle, and the WCN-colored structure on the right. All structures follow a continuous rainbow color scheme ranging from red to blue, with the red designating the residue that is the farthest from the centroid, the least packed or the least conserved, the blue designating the residue that is closest to the centroid, or the most packed, or the most conserved, and the colors in-between designating the corresponding intermediate values of the quantities said.

