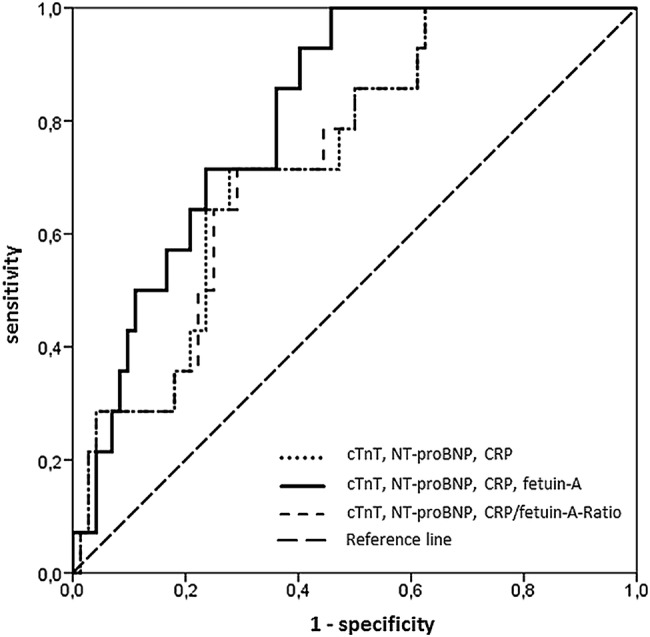
Figure 4.

Analysis of receiver operating characteristic of three models (model 1: cardiac troponin T (cTnT), N-terminal pro brain natriuretic peptide (NT-proBNP), C reactive protein (CRP) (dotted line); model 2: cTnT, NT-proBNP, CRP and fetuin-A (continuous line); model 3: cTnT, NT-proBNP and CRP/fetuin-A-ratio (broken line)) for prediction of adverse left ventricular remodelling at 4 months. Model 2 (area under the curve=0.812, 95% CI 0.712 to 0.911) resulted in a higher prognostic value for the prediction of adverse remodelling compared with model 1 (area under the curve=0.736, 95% CI 0.609 to 0.863) and model 3 (area under the curve=0.735, 95% CI 0.609 to 0.861).
