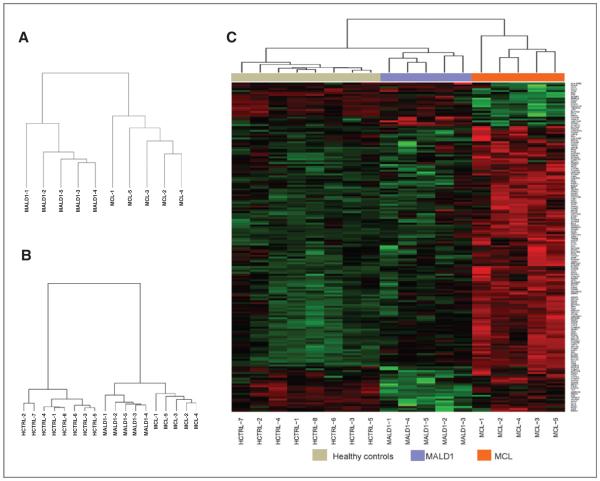
Figure 2.
Gene expression analysis of CD19+ peripheral blood B cells reveals significant differences between MALD1 and MCL. A, unsupervised hierarchical clustering of the gene expression profiles (GEP) from healthy controls (HCTRL), MALD1, and MCL cases. B, unsupervised hierarchical clustering of GEP from MALD1 and MCL cases separates the 2 entities based on distinct gene signatures. C, heatmap showing the results of the supervised analysis using genes differentially expressed between MALD1 and MCL cases. The list of genes appearing in the heatmap is detailed, in order of appearance, in Supplementary Table S4.

