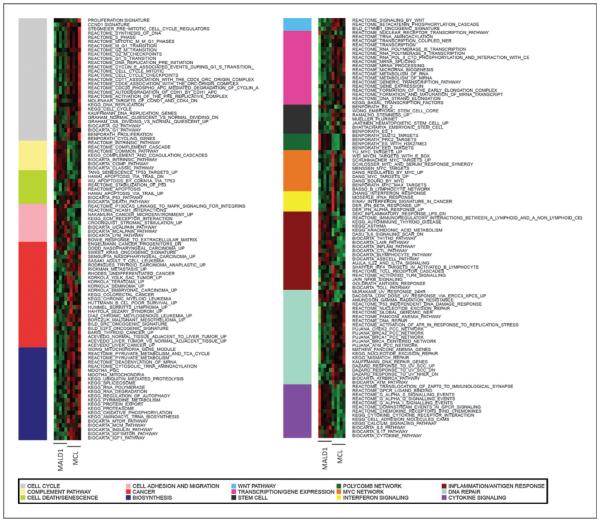
Figure 3.
Biologic pathways differentiate MALD1 and MCL cells. Functional heatmap showing relative enrichment of biologic pathways in the 2 groups. This heatmap was generated by aggregating results of the GSEA and IPA analyses in common categories and taking the mean of gene expression in each pathway as the representative value for each sample.

