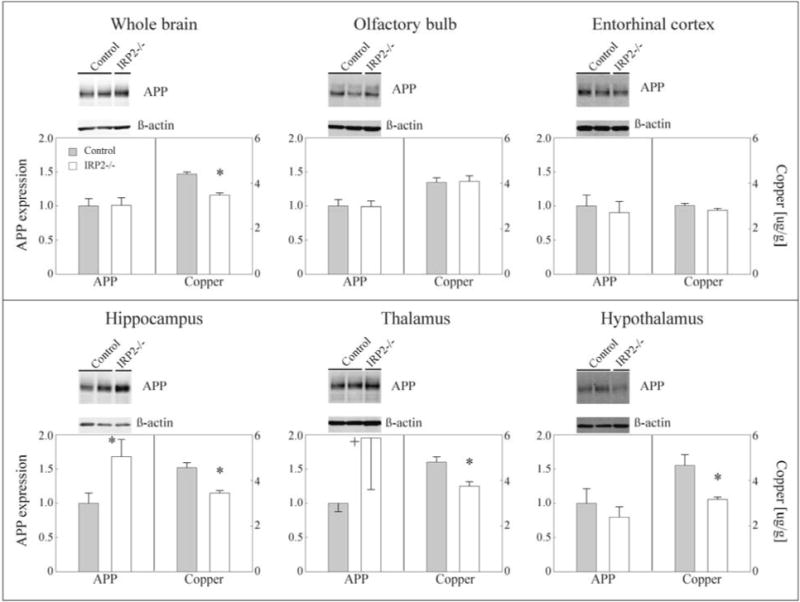
Figure 2.

Copper levels and AβPP expression in IRP2−/− and C57BL/6 control mouse brain at 6 weeks of age (no difference between IRP2−/− and C57BL/6 control mice was seen for copper and AβPP expression at 24 weeks; data not shown). Gray bar: combined controls C57BL6/NTac + C57BL6/Jax, white bar: IRP2−/−. Left bar graphs show AβPP expression with corresponding left abscissa scale representing AβPP band intensity relative to β-actin. Representative western blot images above each graph (n = 5–7 per brain region and mouse strain; whole brain: n = 2–4). Right bar graphs show total copper levels with corresponding with right abscissa scale representing μg of copper/g wet tissue weight (n = 6–9 per brain region, mouse strain and age; whole brain: n = 4–8). Errors represent SEM; *p<0.05 IRP2−/− versus control, +p<0.1 IRP2−/− versus control.
