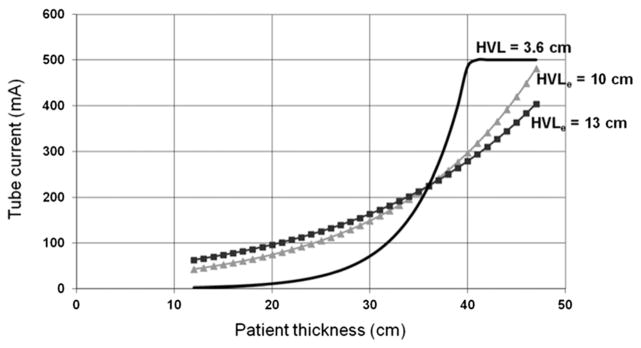
FIGURE 1.

Examples of the tube current modulation schemes based on a 36-cm reference patient thickness (tref = 36 cm) and 225-mA reference tube current (mAref = 225 mA). The solid line represents the tube current required to achieve a constant noise across patient thickness variations. The scanner reaches a maximum tube current for patients at least 40 cm thick, which could lead to sacrifices in image quality through longer gantry rotation times and/or lower spiral pitch values. The dotted curve represents a less aggressive modulation of tube current, where the tube current is not increased as strongly for large patients or decreased as strongly for small patients. This maintains adequate image noise in small patients and avoids excessive radiation doses for large patients. The curves reflect the abdominal (HVLe = 10 cm; b = 0.36) and thoracic (HVLe = 13 cm; b = 0.28) technique charts used in our large clinical practice for more than 2 decades (see Eq. [7]).
