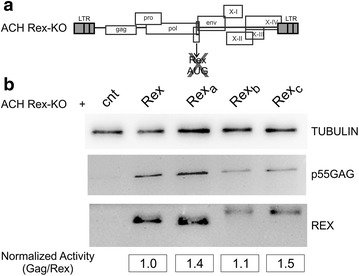
Figure 5.

Functional analysis of Rex isoforms using a Rex-KO HTLV-1 molecular clone. a Schematic representation of the Rex knock-out HTLV-1 molecular clone (ACH Rex-KO) [5]. b Expression of the p55 Gag precursor and Rex after the co-transfection of HLtat cells with 0.5 µg of ACH Rex-KO and 0.5 µg of BlueScript (negative control, Stratagene), or pMH-Rex, pMH-Rexa, pMH-Rexb or pMH-Rexc. The lower part of b shows the normalized Rex activity estimated by calculating the ratio between the Gag and Rex bands after subtraction of the background value obtained in the negative control sample. For immunoblot analysis, cells were harvested 24 h after transfection in Mammalian Cell Disruption Buffer (Paris-Kit, Ambion) supplemented with phosphatase inhibitors (PhosSTOP, Roche) and protease inhibitors (Complete, Roche). Protein concentration was determined by the Coomassie Protein Assay Kit (Thermo Scientific). Protein lysates (50 µg) were subjected to SDS-PAGE (12% acrylamide/bis-acrylamide) and electrotransferred to Hybond-C Extra membrane (GE Healthcare). Blots were cut into strips and blocked with 5% non-fat dry milk (Euroclone)-0.1% Tween 20-TBS (tris-buffered saline), and incubated overnight at 4°C with rabbit anti-Rex polyclonal antibody (1:5,000) [16], mouse anti-HTLV-1 p24 monoclonal antibody (1:500, Helvetica Health Care) and mouse anti-α-tubulin monoclonal antibody (1:2,000; Sigma-Aldrich) in 5% non-fat dry milk-0.1% Tween-TBS. Blots were washed and incubated for 1.5 h with horseradish peroxidase-conjugated anti-mouse or anti-rabbit secondary antibody (Pierce) diluted 1:2,500 in 5% non-fat dry milk-0.1% Tween-TBS. Blots were developed using chemiluminescence (Supersignal, Pierce) and immunoreactive bands were visualized and quantified using a Uvitec Chemiluminescence Imaging System (Cambridge) and UVIsoft Analysis software.
