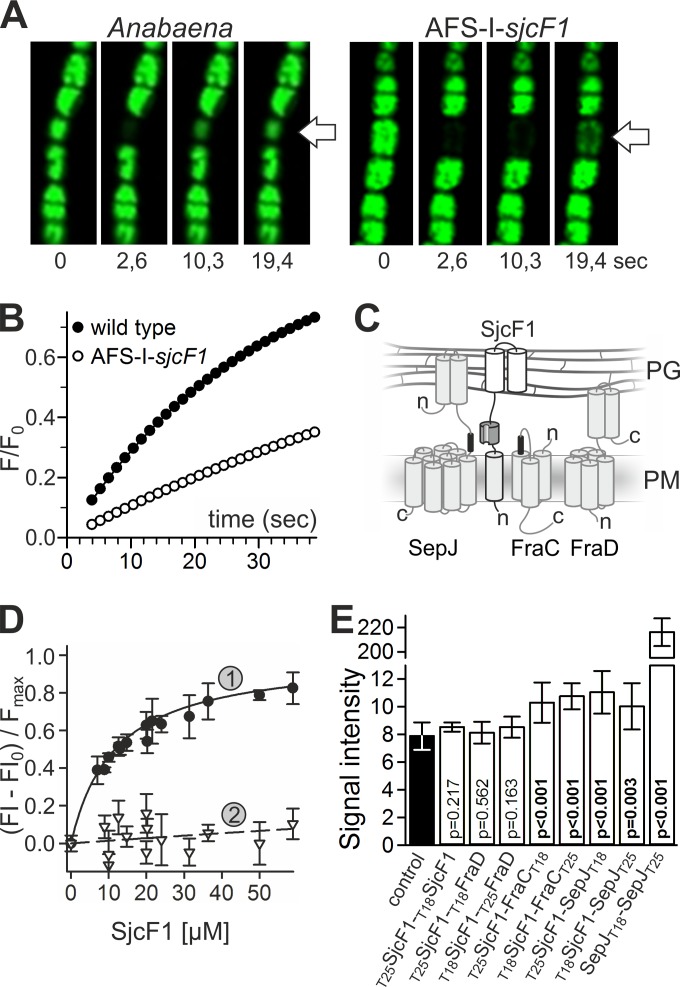
FIG 6 .
Relation of SjcF1 to septal junction complexes. (A) Representative time series of calcein recovery in the Anabaena wild-type and AFS-I-sjcF1 strains. The first image is before the bleach pulse; the times after the bleaching are indicated. (B) Recovery rate of calcein fluorescence for a representative measurement in the Anabaena wild-type and AFS-I-sjcF1 strains. (C) Scheme of the topology of SepJ, FraC, FraD, and SjcF1 (see the material in the expanded view) in the plasma membrane (PM) and the periplasm (PG, peptidoglycan). Transmembrane domains in the PM, the coiled-coil domains of SepJ and FraD in the periplasm (grey cylinders), the PG binding domains of SjcF1 (white cylinders), the SH3 domain (dark gray), and the SH3 binding motifs (black) are indicated. (D) Fluorescent-labeled peptide representing the SH3 binding motif of FraC (1, FVEPVLPVPI; KD, 12 ± 1 µM) or a mutated version of the SepJ motif (2, PLTSEKSSEP; KD, >2 mM) was incubated with increasing concentrations of His-tagged SjcF1. The fluorescent anisotropy was analyzed. For representation, the initial value was subtracted and the curve was normalized to the maximal expected value. The lines indicate the least square fit analysis to the equation F = Fmax × [SjcF1]/(KD + [SjcF1]). (E) The average of the β-galactosidase activity of E. coli with plasmid combinations producing the indicated proteins (white bars) and of the controls of either two empty plasmids (producing T18 and T25) or one empty and one fusion protein-encoding plasmid in all combinations possible (black bar) is shown with the standard deviation. Probability values of the t test for significance of the differences are indicated (p).

