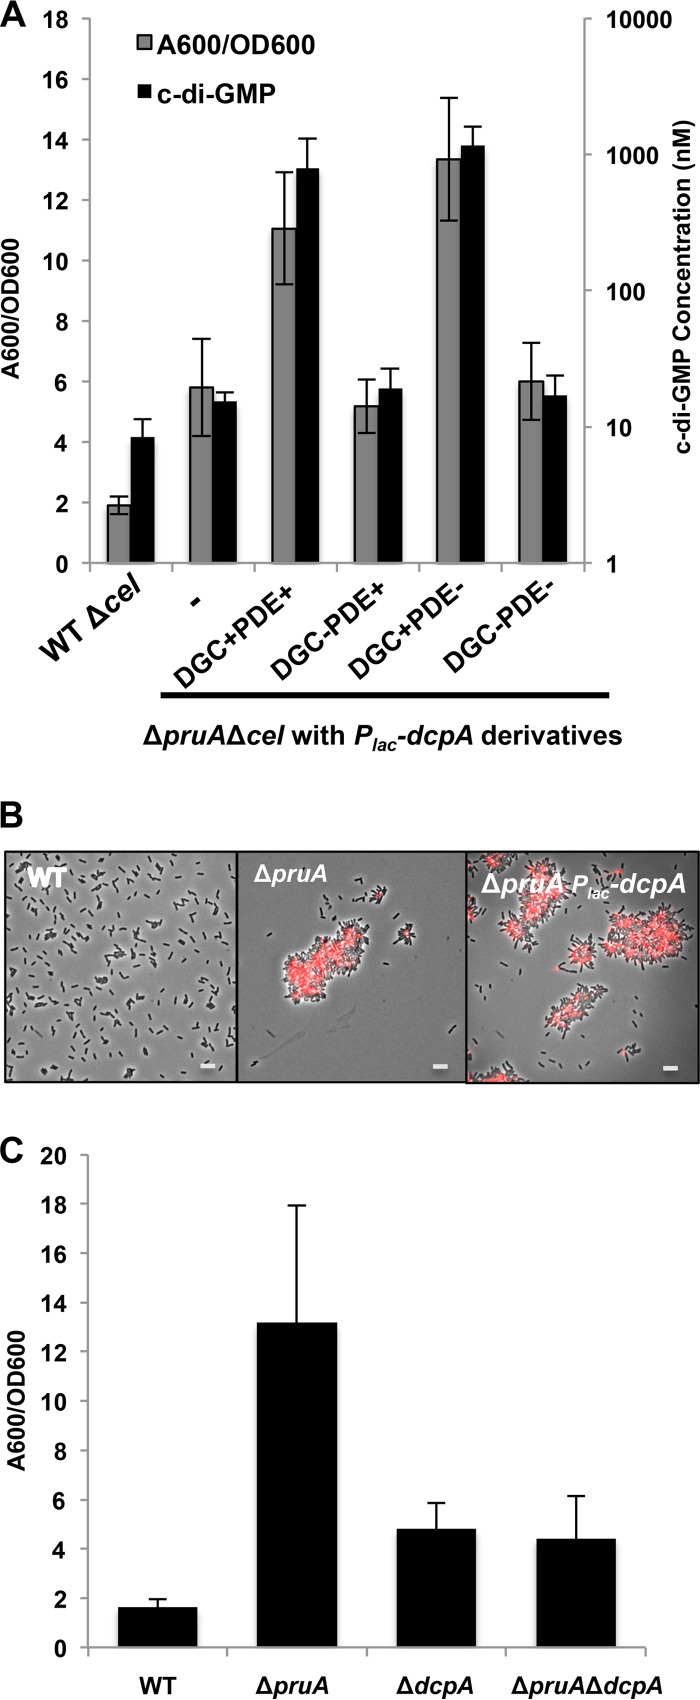
FIG 5 .
Regulatory connections between PruA and DcpA. (A) Biofilms grown for 48 h on PVC coverslips (gray bars) were quantified as described in the legend to Fig. 1C. The error bars show 1 SD. c-di-GMP levels were also quantified (black bars). Strains were grown to stationary phase, nucleotides were extracted, and c-di-GMP was measured as described in Materials and Methods. A DcpA variant with catalytic site GGDEF→GGDAF mutation (DGC−), DcpA variant containing catalytic site EAL->AAL mutation (PDE−), and mutant with no plasmid inserted (-) were used. The Δcel background was utilized to reduce excess clumping. Values are results of three (biofilm) or two (c-di-GMP) independent biological replicates consisting of three technical replicates each. The error bars show 1 SD. (B) UPP production visualized by staining with afWGA, as described in the legend to Fig. 3C. IPTG (400 µM) was added to each culture. Bars, 5 µm. (C) Adherent biomass grown for 48 h was quantified as described above for panel A, with IPTG omitted.

