Figure 4.

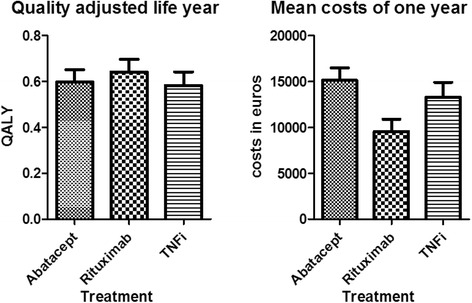
Mean quality-adjusted life-years and medication-related costs in a 1-year period. Error bars represent the upper bars of the 95% confidence intervals. QALY, Quality-adjusted life-year.

Mean quality-adjusted life-years and medication-related costs in a 1-year period. Error bars represent the upper bars of the 95% confidence intervals. QALY, Quality-adjusted life-year.