Fig. 1.

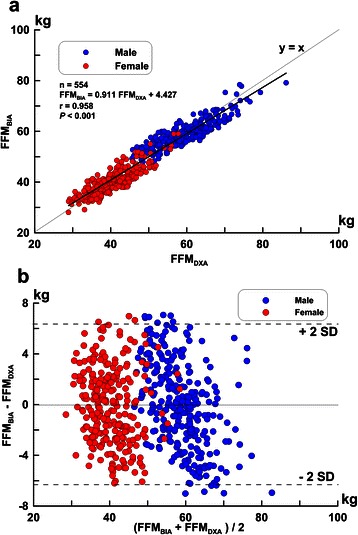
Correlations (a) and difference (b) of FFM in all subjects estimated by FFMDXA and FFMBIA. The difference (calculated as FFMBIA - FFMDXA per Bland-Altman) is plotted against the mean of the measurements of FFMDXA and FFMBIA

Correlations (a) and difference (b) of FFM in all subjects estimated by FFMDXA and FFMBIA. The difference (calculated as FFMBIA - FFMDXA per Bland-Altman) is plotted against the mean of the measurements of FFMDXA and FFMBIA