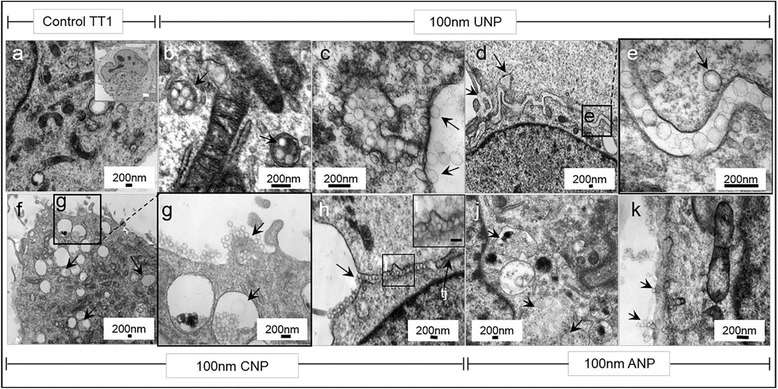
Fig. 7.

Interaction and uptake of 100 nm polystyrene UNP. CNP and ANP by TT1 cells 4 h after exposure. Following exposure to 50 μg/ml NPs, compared to non-exposed TT1 cells (a), UNPs were taken up via endocytosis as an agglomerate (arrows in b) and as individual particles (arrows in c). UNPs were also observed paracellularly and were taken up individually (arrows in d-e). Similar observations were made following TT1 cell exposure to CNPs (f; arrows in g indicate endocytosis and macropinocytosis). The CNPs also travelled paracellularly (left arrow in h, right arrow indicates tight junction-tj). The ANPs were taken up via endocytosis as agglomerates (arrows in j) and individually (arrows in k), but few were observed paracellularly. The percent cell uptake of all NPs by all cell types is shown in Fig. 6m-o in comparison with the 50 nm NPs. Scale bars in a-k are 200 nm; a total of 90 cells were examined
