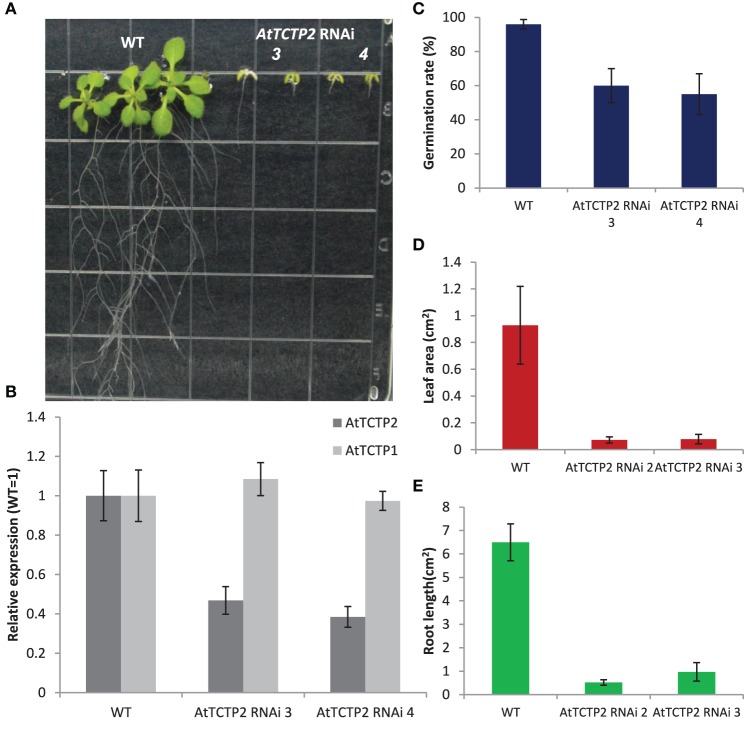
Figure 4.
Silencing of AtTCTP2 results in abnormal phenotypes similar to heterozygous SALK_045146 plants. (A) Representative phenotypes of AtTCTP2-RNAi Arabidopsis lines vs. wild type plants 25 days after germination (dag) on solid MS medium. (B) Quantification of AtTCTP2 and AtTCTP1 transcripts in both WT and AtTCTP2-RNAi lines; qRT-PCRs were performed using as template 50 ng of total RNA extracted from a pool of five randomly selected plants per line; results are shown as AtTCTP2 transcript levels in AtTCTP2-RNAi lines relative to WT (both normalized relative to 18S) using the relative ΔΔCT method described previously. (C) Germination rate of both AtTCTP2-RNAi lines and WT controls measured 7 dag. (D) Leaf area of AtTCTP2-RNAi lines and WT controls determined 25 dag. (E) Root length of WT controls and both RNAi lines 25 dag. (C–E) 30–40 representative plants were selected for analysis; (D,E) both measurements were calculated using imageJ free software (http://imagej.nih.gov/ij/). Size bars = 1.1 cm.

