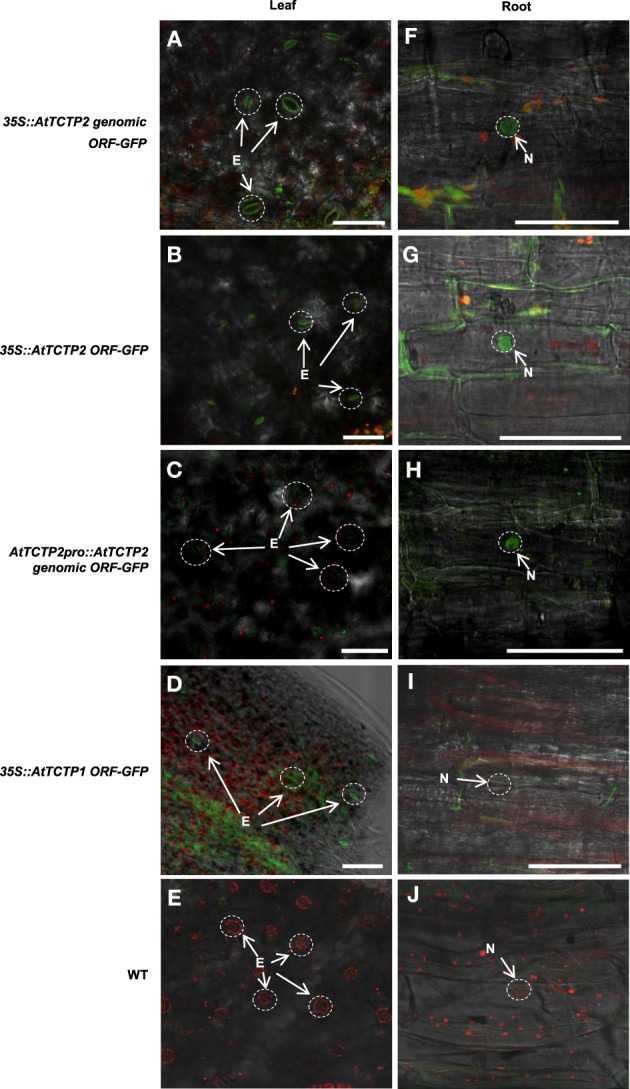
Figure 6.

AtTCTP2-GFP accumulation indicates a correct processing of the AtTCTP2 transcript. (A,F) 35S::AtTCTP2 genomic ORF-GFP, (B,G) 35S::AtTCTP2 ORF-GFP, (C,H) AtTCTP2Pro:AtTCTP2-GFP, and (D,I) 35S::AtTCTP1 ORF-GFP plants. GFP signal was observed in stomata and in root cortex cell nuclei. (E,J) WT control showing background fluorescence in leaf and root tissue. Bars = 50 μM.
