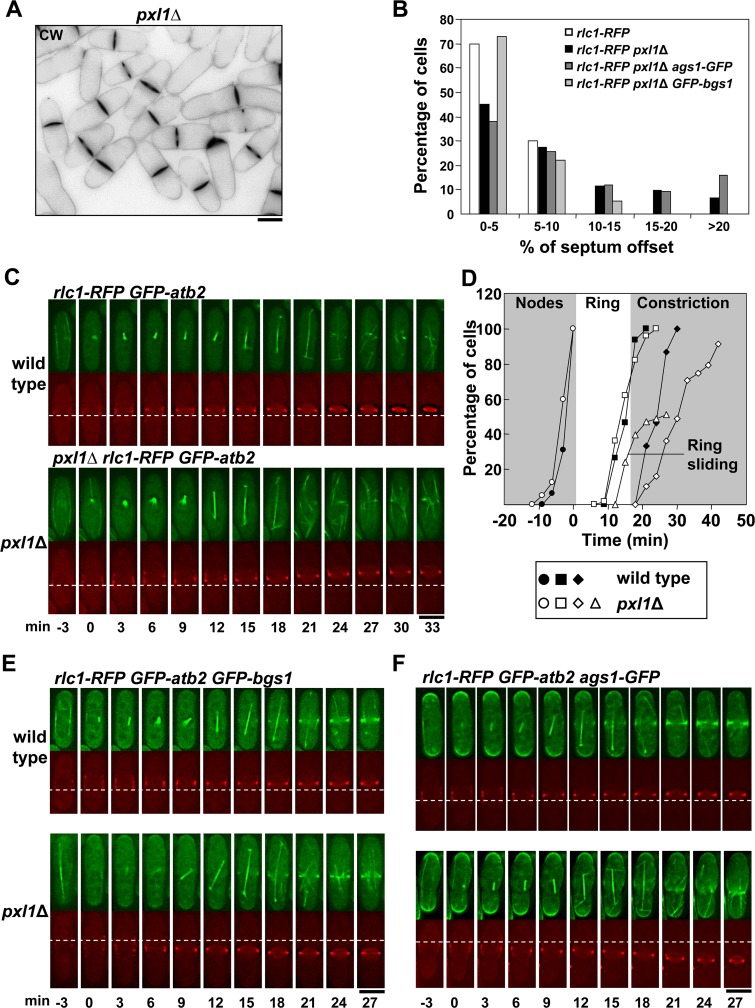
Fig 1. Pxl1 is required for stable CAR and septum positioning in the middle of the cell.
(A) A Calcofluor White (CW) staining image of pxl1Δ cells with off-centered septa. (B) Histogram showing the indicated intervals of septum position measured as the percent of septum offset from the cell center: white bars, wild-type cells (n = 40); black bars, pxl1Δ cells (n = 142); dark grey bars, pxl1Δ ags1 +-GFP cells (n = 131); and light grey bars, pxl1Δ GFP-bgs1 + cells (n = 59). The position of the septum was measured with Image J software as described in the Materials and Methods section. (C) Time series of fluorescence micrographs (one medial z slide, 3 min intervals) of cells carrying Rlc1-RFP and GFP-Atb2. The first panel shows a wild-type cell with a centrally located ring that began to constrict at +24 min. The second panel shows a pxl1Δ cell with a ring that moved toward the upper pole at +15 min. Spindle microtubules appear at time 0. (D) Time courses of appearance of cortical nodes tracked with Rlc1-RFP (circle), completion of ring (square), onset of ring constriction (diamond), and ring sliding (triangle). Filled symbols are wild-type cells (circle n = 16; square n = 15; diamond n = 15), and open symbols are pxl1Δ cells (circle n = 40; square n = 50; diamond n = 45; triangle n = 27). (E) Time series of fluorescence micrographs (one medial z slide, 3 min intervals) of cells carrying GFP-Bgs1, Rlc1-RFP and GFP-Atb2. The first panel shows a wild-type cell where Bgs1 was detected in the cell middle at +15 min. The second panel shows a pxl1Δ cell with a ring that moved toward the lower pole at +18 min and where Bgs1 was detected in the cell middle at +15 min. Spindle microtubules appear at time 0. (F) Time series of fluorescence micrographs (one medial z slide, 3 min intervals) of cells carrying Ags1-GFP, Rlc1-RFP and GFP-Atb2. The first panel shows a wild-type cell where Ags1 was detected in the cell middle at +12 min. The second panel shows a pxl1Δ cell with a ring that moved toward the lower pole at +18 min where Ags1 was detected at +15 min. Spindle microtubules appear at time 0. Dashed line: reference for the ring position. Elapsed time is shown in minutes. Scale bars, 5 μm.

