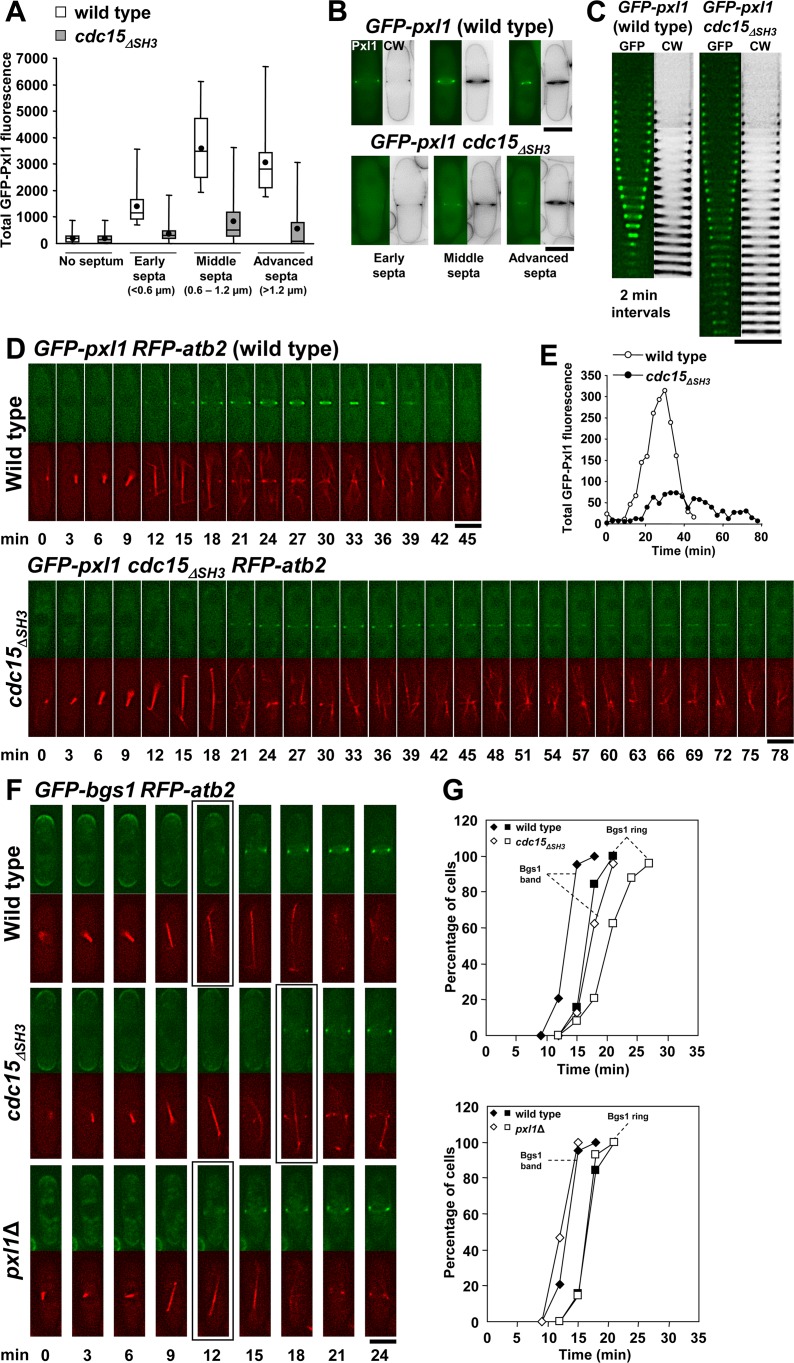
Fig 5. Cdc15 SH3 domain is necessary for proper concentration of Pxl1 at the CAR.
(A) Box plot showing the total fluorescence of GFP-Pxl1 in the cell middle of wild-type (n = 90) and cdc15 ΔSH3 cells (n = 214). GFP-Pxl1 fluorescence was measured in cells stained with CW, and divided into four categories depending on the length of the septum in the cell: 1) no septum 2) early septum (less than 0.6 μm); 3) middle septum (0.6 to 1.2 μm); and 4) advanced septum (more than 1.2 μm). Total fluorescence was quantified by using Image J software as described in the Materials and Methods section. (B) Fluorescence micrographs showing representative septated wild-type and cdc15 ΔSH3 cells carrying GFP-Pxl1, and used to measure the total fluorescence of GFP-Pxl1 in A. (C) Kymographs of fluorescence time series (one middle z slide, 2 min intervals) of wild-type and cdc15 ΔSH3 cells stained with CW and carrying GFP-Pxl1. (D) Time series of fluorescence micrographs (one medial z slide, 3 min intervals) of wild-type (upper panels) and cdc15 ΔSH3 (lower panels) cells carrying GFP-Pxl1 and RFP-Atb2. Spindle microtubules appear at time 0. (E) Total fluorescence of GFP-Pxl1 in the cell middle of the time series shown in D. Fluorescence was quantified along the time as described in A. (F) Time series of fluorescence micrographs (one medial z slide, 3 min intervals) of cells carrying GFP-Bgs1 and RFP-Atb2. The first panel shows a wild-type cell where the Bgs1 band was detected in the septum assembly site at +12 min. The second panel shows a cdc15 ΔSH3 cell where the Bgs1 band was detected in the septum assembly site at +18 min. The third panel shows a pxl1Δ cell where the Bgs1 band was detected in the septum assembly site at +12 min. Spindle microtubules appear at time 0. Squares indicate the first detection of Bgs1 as a band in the septum assembly site in the wild-type. (G) Time courses of appearance of the GFP-Bgs1 band (diamond) and GFP-Bgs1 ring (square). Open symbols are wild-type cells, and filled symbols are cdc15 ΔSH3 (upper graph) and pxl1Δ (lower graph) cells. The same wild-type cells were used in both graphs. Wild-type (diamond n = 19; square n = 19), cdc15 ΔSH3 (diamond n = 24; square n = 24), and pxl1Δ cells (diamond n = 15; square n = 14). Elapsed time is shown in minutes. Scale bars, 5 μm.

