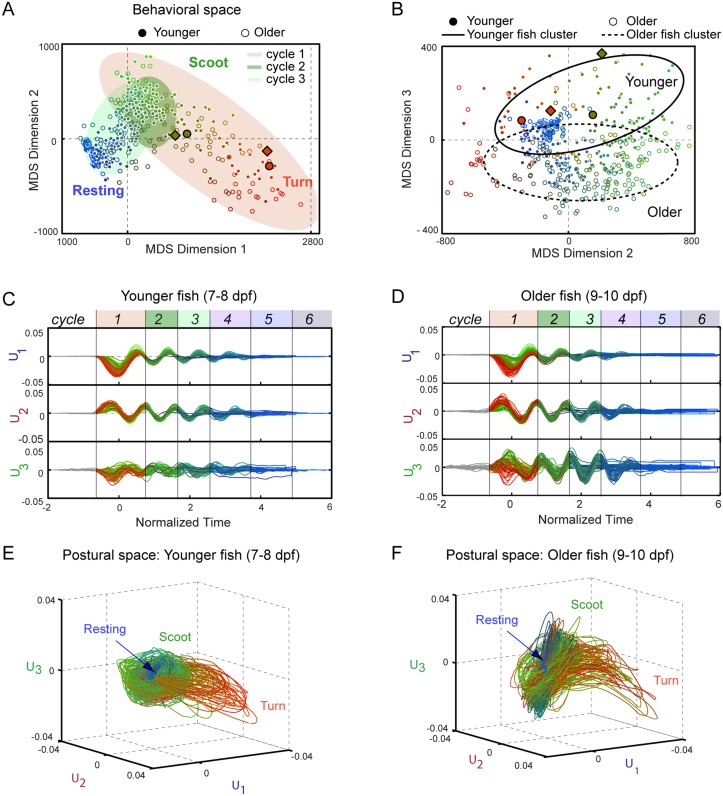
Fig 4. Behavioral space of free swimming zebrafish.
(A–B) Ensemble of swim bout trajectories (N = 115) embedded by multi-dimensional scaling (MDS) into low-dimensional “behavioral” space. Each cycle of every trajectory is represented by a single point (filled circles for younger larvae (N = 8; 7–8 dpf), open circles for older larvae (N = 12; 9–10 dpf)). The distances between points reflect their behavioral similarities/differences. MDS dimensions 1 and 2 (A) reveal behavioral regions corresponding to turns (red points), scoots (green) and rests (blue). The shaded ellipses demarcate the points from cycles 1–3 of the trajectory (orange, light green, green, respectively. S8A Fig displays the cycles individually). MDS dimensions 2 and 3 (B) reveal differences with zebrafish age (solid ellipse for younger larvae; dotted ellipse for older larvae). The ellipses were determined using PCA analysis of the behavioral space in MDS dimension 1 and dimension 2 for each cycle in (A) and MDS dimension 2 and dimension 3 for cycle 1 in (B). The principal axes of the ellipses are the singular values from PCA. Simulated trajectories from the neuro-kinematic model in Figs 5 and 6 and its training data are shown in diamonds and circles with black outline, respectively. (C) Amplitudes U 1, U 2, and U 3 vs. normalized time of the trajectories in A and B from younger larvae. (D) Same plot for older larvae. Shaded areas demarcate each cycle of the trajectory. (E–F) Postural space representation of the trajectories in C and D, respectively. Throughout, color represents the location in the behavioral space and cycle number: in the RGB colormap, red and green channels correspond to position along MDS dimension 1 and 2, respectively, and the blue channel to the cycle number.

