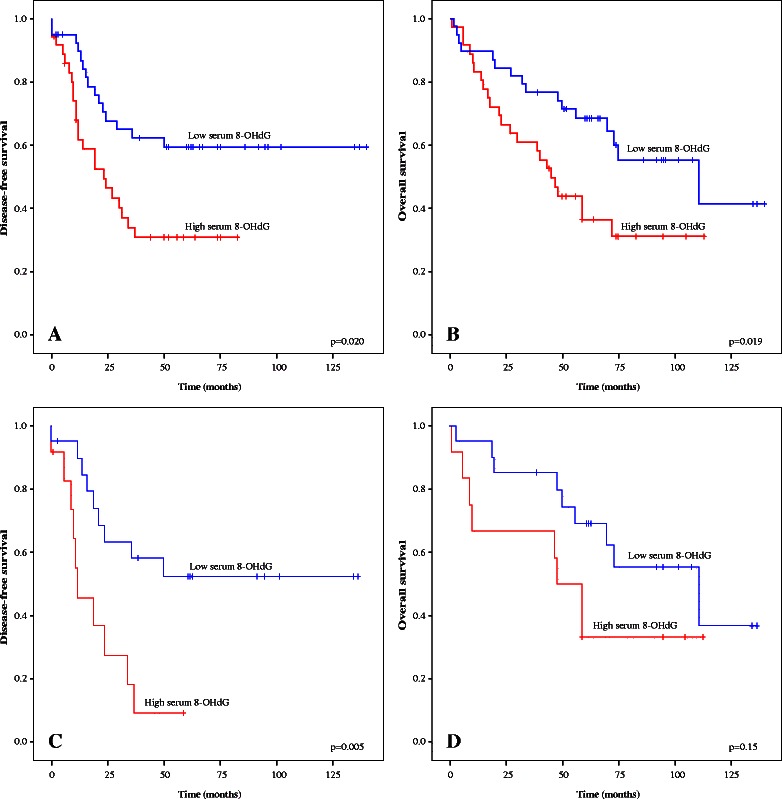
Fig. 2.

Kaplan–Meier curves demonstrating relationships between serum 8-OHdG concentrations and disease-free survival in the whole study population (a), overall survival in the whole study population (b), disease-free survival in cases of carcinoma with endometrioid histology (c) and overall survival in the endometrioid histology group (d)
