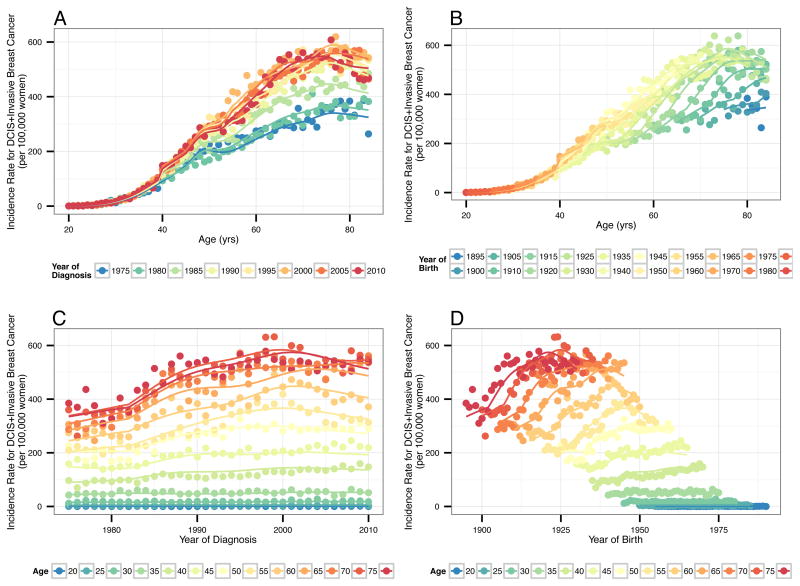
Figure 1.
Observed and modeled overall breast cancer incidence rates for the 9 Surveillance, Epidemiology and End Results (SEER) registries, 1975–2010 by (A) age and period (year of diagnosis), (B) age and cohort (year of birth), (C) period (year of diagnosis) and age, and (D) cohort (year of birth) and age. Includes rates per 100,000 women for DCIS and invasive breast cancer combined. Observed crude rates shown with circles. Modeled rates shown with solid lines.

