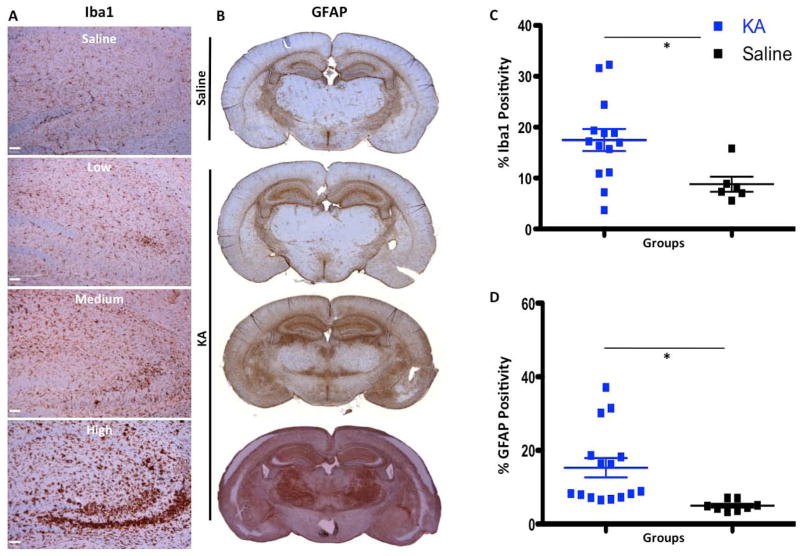
Figure 2.
Neural loss followed by activation of microglia and astrocytes in KA-treated animals. A, Images of Iba1 IHC of saline- and KA-treated animals showing that the highest up-regulation of Iba1 (increased brown intensity and size of cells) is in high KA responders. B, IHC images of GFAP in saline- and KA-treated animals showing that the highest level of reactive astrogliosis is in the high responders. C–D, graphs of quantification of Iba1 and GFAP staining showing significant up-regulation of reactive microgliosis and astrogliosis in KA-treated animals compared to saline-treated animals 7 days post-KA injection. Scale bar for the top right image of A is 500 μm, for the rest of the images in A, B, C and D scale bars are 50μm. *,**, and *** represent significance determined by unpaired t-test analysis for p<0.05, p<0.01, and p<0.001

