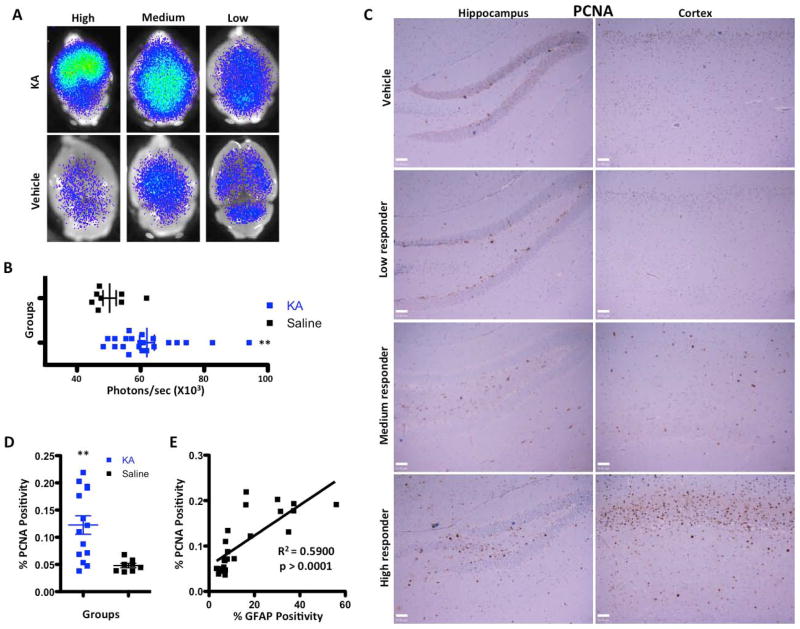
Figure 4.
Proliferation is increased and the Gli pathway is activated following injection of KA. A, Gli bioluminescence imaging of KA- and saline-injected brains imaged 7 days post-injection. A variable increase in BLI intensity was noted in KA-injected mice. B, Quantification and statistical analysis of the BLI intensity in saline and KA-treated animals 7 days post-injection. C, Images of PCNA immunohistochemistry of dentate gyrus and cortex of KA- and saline-treated brains 7 days post-injection. D, Quantification of PCNA immunohistochemistry for KA- and saline-treated brains 7 days after injection (p < 0.001). E, Simple linear regression showing a positive correlation (r2) between GFAP intensity and PCNA expression in KA-injected brains and the corresponding p value. Scale bars for C are 50μm.

