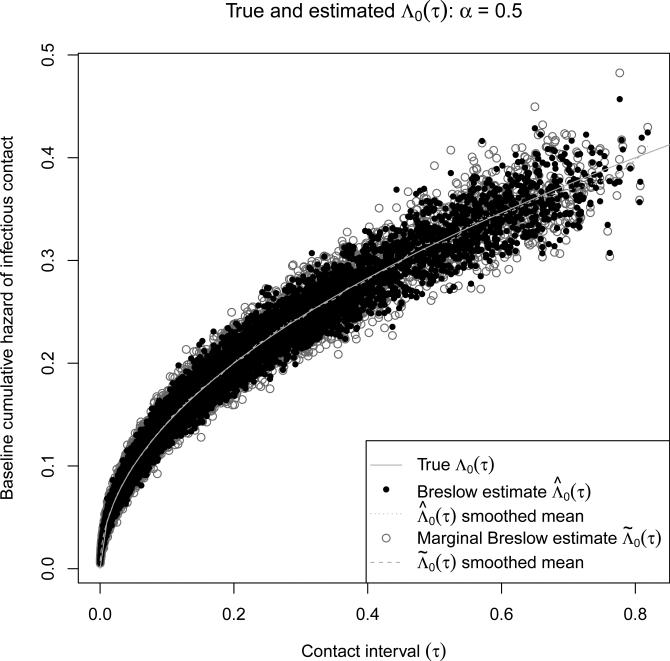
Figure 4.
and versus true Λ0(τ) for the 6000 simulations with a Weibull(0.5, 0.2) baseline contact interval distribution. For each simulation and each estimator, a circle is shown for the 10th, 25th, 50th, 75th, and 90th percentiles of all possible contact intervals. The smoothed means were calculated using cubic smoothing splines.

