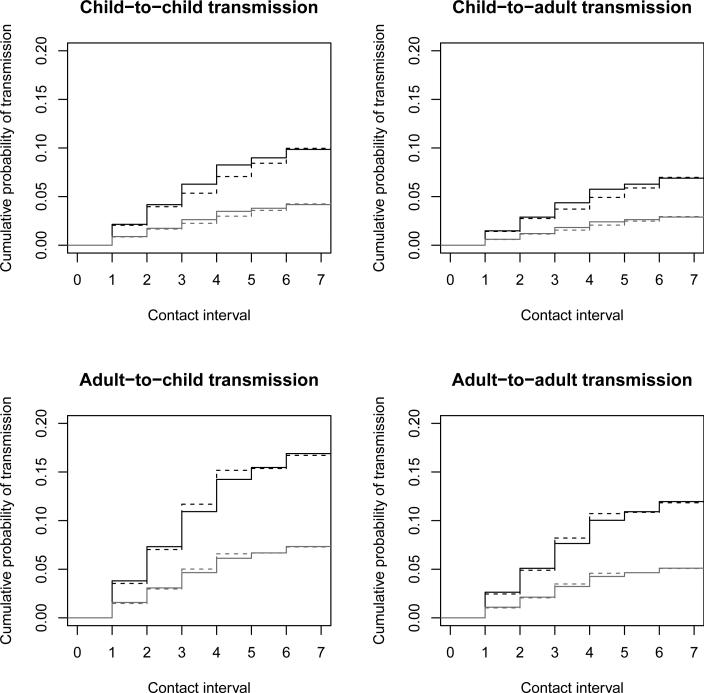
Figure 7.
Household transmission of 2009 pandemic influenza A(H1N1) in Los Angeles County. Each panel shows separate curves for susceptible contacts with (gray lines) and without (black lines) antiviral prophylaxis. The solid lines are based on the multivariable model, and the dotted lines are based on the model stratified by ageinf.

