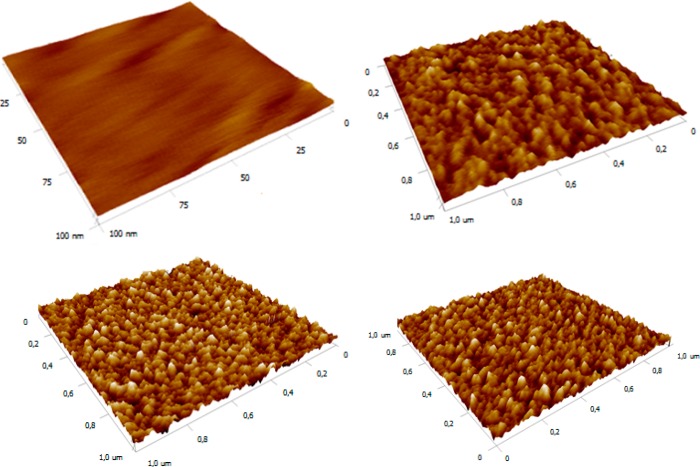
Figure 3.
3D AFM images (from top left to bottom right) of CB SAM-modified Au surface after piranha cleaning procedure (0 min activation) and after SNA lectin immobilization with 5, 10, and 15 min activation times. The range of the z-axis in all AFM images was set at 5 nm to see the differences in the surface topology clearly.

