
Figure 4.
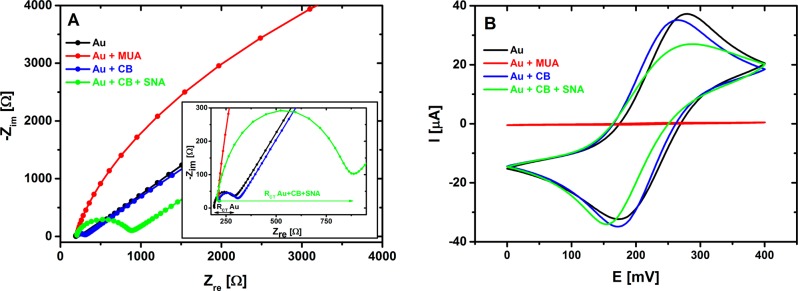
Nyquist plots (obtained from EIS investigation) of bare gold electrode (black), CB SAM layer deposited on Au surface (blue), and the same layer after immobilization of SNA lectin (green) (A). Inset in (A) shows Nyquist plots with high magnification zoomed to initial values, and also shows that RCT value is read as a diameter of a semicircle for a particular Nyquist plot as depicted for bare Au surface (black) and for surface after immobilization of SNA lectin (green). Corresponding cyclic voltammograms for all interfacial layers are also shown (B). In this experiment, EIS and CV of traditional SAM layer applied to covalent protein immobilization composed of 11-mercaptoundecanoic acid (MUA, red line with RCT too high to be calculated) were also characterized.