
Figure 1.
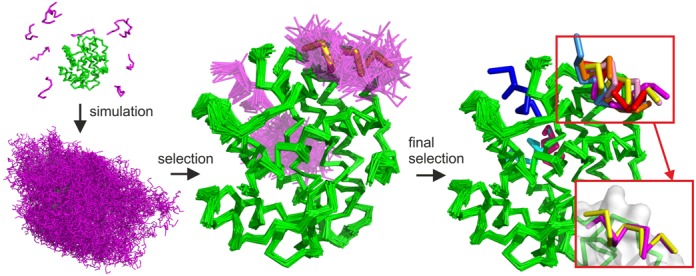
Basic stages of the CABS-dock protocol illustrated on the example benchmark case (PDB ID: 2P1T). The protein receptor is colored in green, modeled peptide conformations in magenta and the reference native peptide structure in yellow. The following CABS-dock stages are visualized: (1) simulation start (from random conformations and positions of the peptide); (2) simulation result (a set of 10 000 models); (3) filtering and clustering result (a set of models grouped in similar binding modes and similar peptide conformations); (4) final models (a set of 10 representative models). In the presented benchmark case, 7 of the 10 final models were docked in the native binding site (marked in red rectangle). Among these, the best accuracy model was within 1.37 Å to the native (shown in the right bottom corner superimposed on the native peptide structure). For a more detailed flow chart of the CABS-dock pipeline, see Supplementary Figure S1.